

High Probability Trades for 30 March - 03 April 2026
One Stealth Stock Is Quietly Holding Up | Edition 36

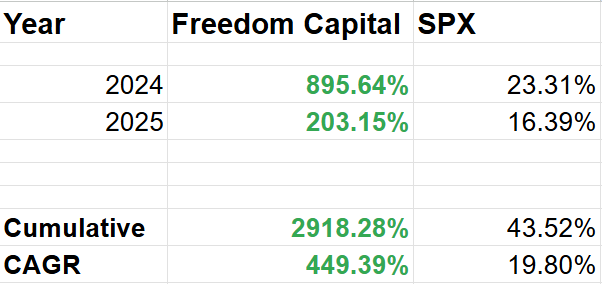
This is my performance for this year up to March 28, 2026.

This is my performance from previous years.
To better understand the strategy we are following and not to buy blindly without any context, please read and analyze my strategy carefully:

Right now, these are my positions:
I am 100% cash position.
Weekly Market Direction
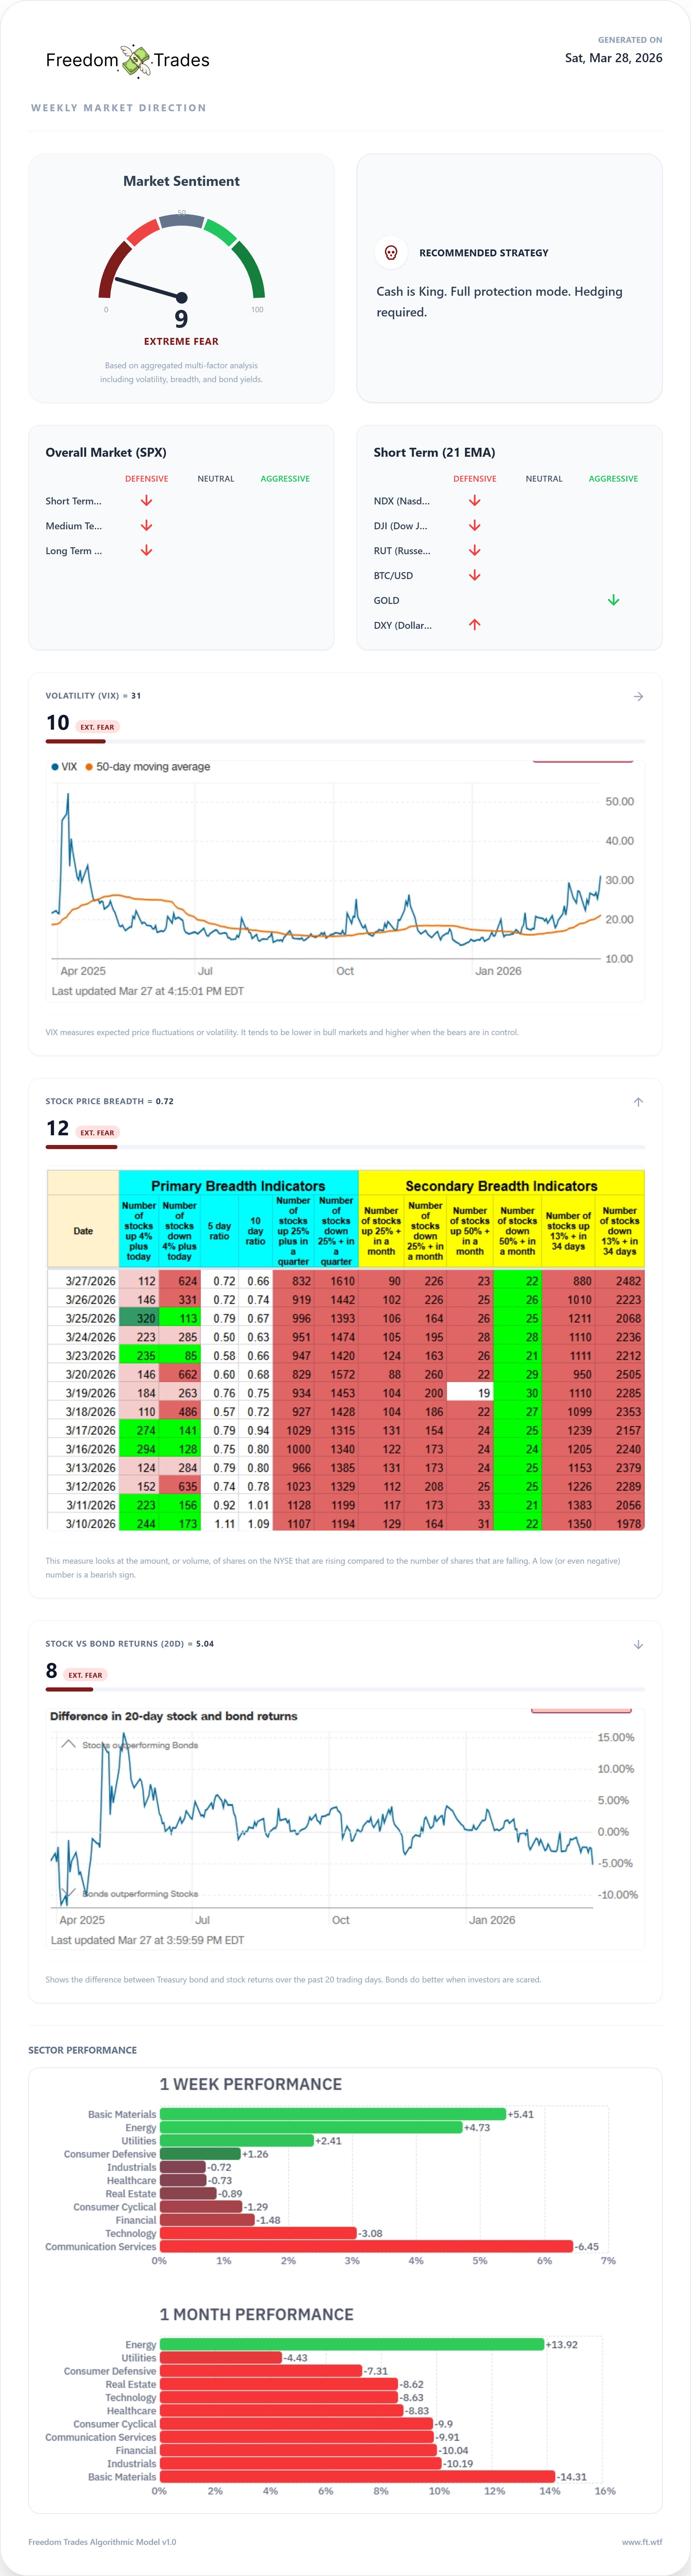
Our sentiment model closed the week at 9, Extreme Fear. The VIX sits at 31, breadth is deeply negative, and bonds are outperforming stocks on a 20-day rolling basis.
The model’s recommendation is clear: Cash is King.
This is a capital-preservation environment.
The Iran conflict continues to set the tone for global markets. Early in the week, reports of a U.S. ceasefire on Iranian energy infrastructure and tentative peace talks pushed equities and bonds higher.
That optimism did not last. Conflicting headlines showed that the U.S., Israel, and Iran remain far apart on any agreement, and by Friday the rally had been fully erased.
President Trump’s pledge Thursday to extend the ceasefire on energy infrastructure failed to lift sentiment.
Markets are no longer pricing a quick resolution; they are pricing a prolonged energy price shock.
The S&P 500, Nasdaq, and Dow finished lower for a fifth consecutive week.
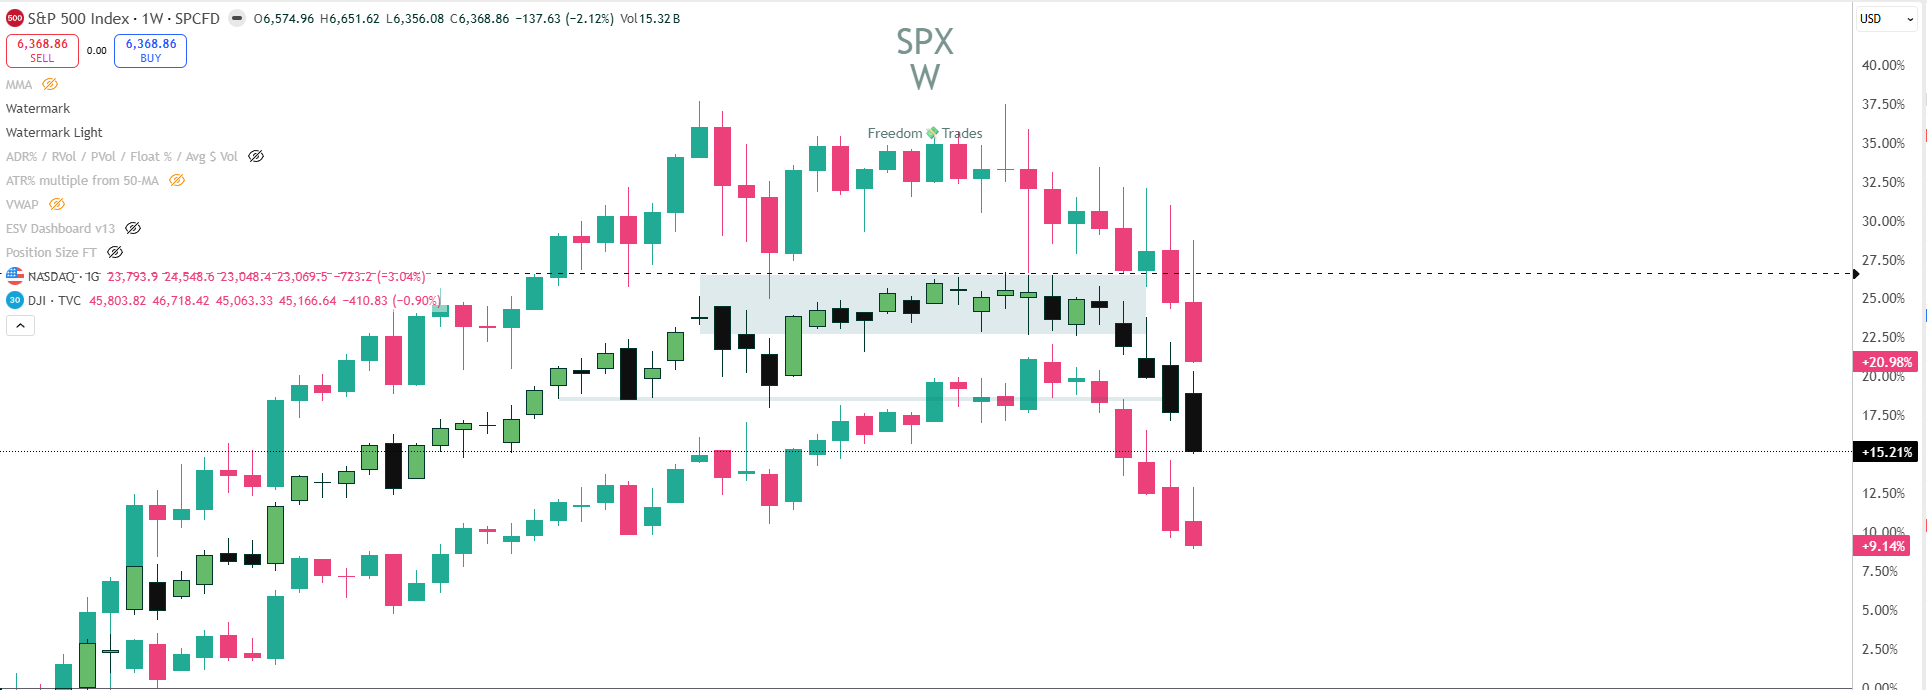
The MidCap 400 and Russell 2000 were the only bright spots, snapping four-week losing streaks.
Large-cap growth continues to drag the market, with Nasdaq now down nearly 10% year-to-date. Large-cap value is outperforming growth for the third week in a row, which tells you where rotation is happening.
Macro: Three Data Points That Matter
1. PMI fell to an 11-month low.
The Flash Composite PMI for March came in at 51.4, down from 51.9 in February.
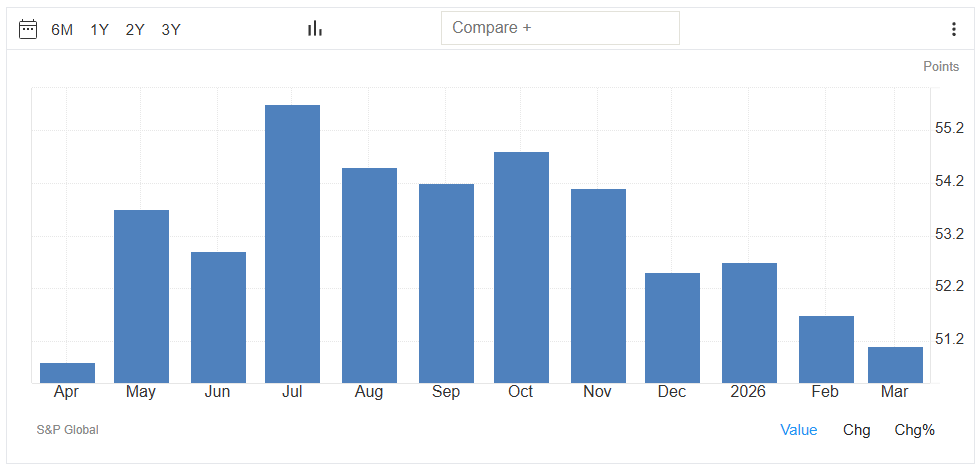
Still above 50, so technically expanding, but the trend is slowing.
Services activity weakened. More importantly, input costs rose at the fastest pace in 10 months, and businesses are passing those costs on at the fastest rate since 2022. Energy and supply disruptions tied to the Iran conflict were the primary drivers.
2. Consumer sentiment is deteriorating.
The University of Michigan Consumer Sentiment Index dropped to 53.3 in March, down from 56.6 in February.
Short-term economic outlook dropped 14%.
One-year inflation expectations rose to 3.8%, the largest month-over-month increase since April 2025. People are feeling the pump. Average gas prices are now near $4 per gallon, up from $2.80 at the start of the year.
That is roughly $20 more every time you fill up.
3. Labor market holding, for now.
Initial jobless claims for the week ended March 21 came in at 210,000.
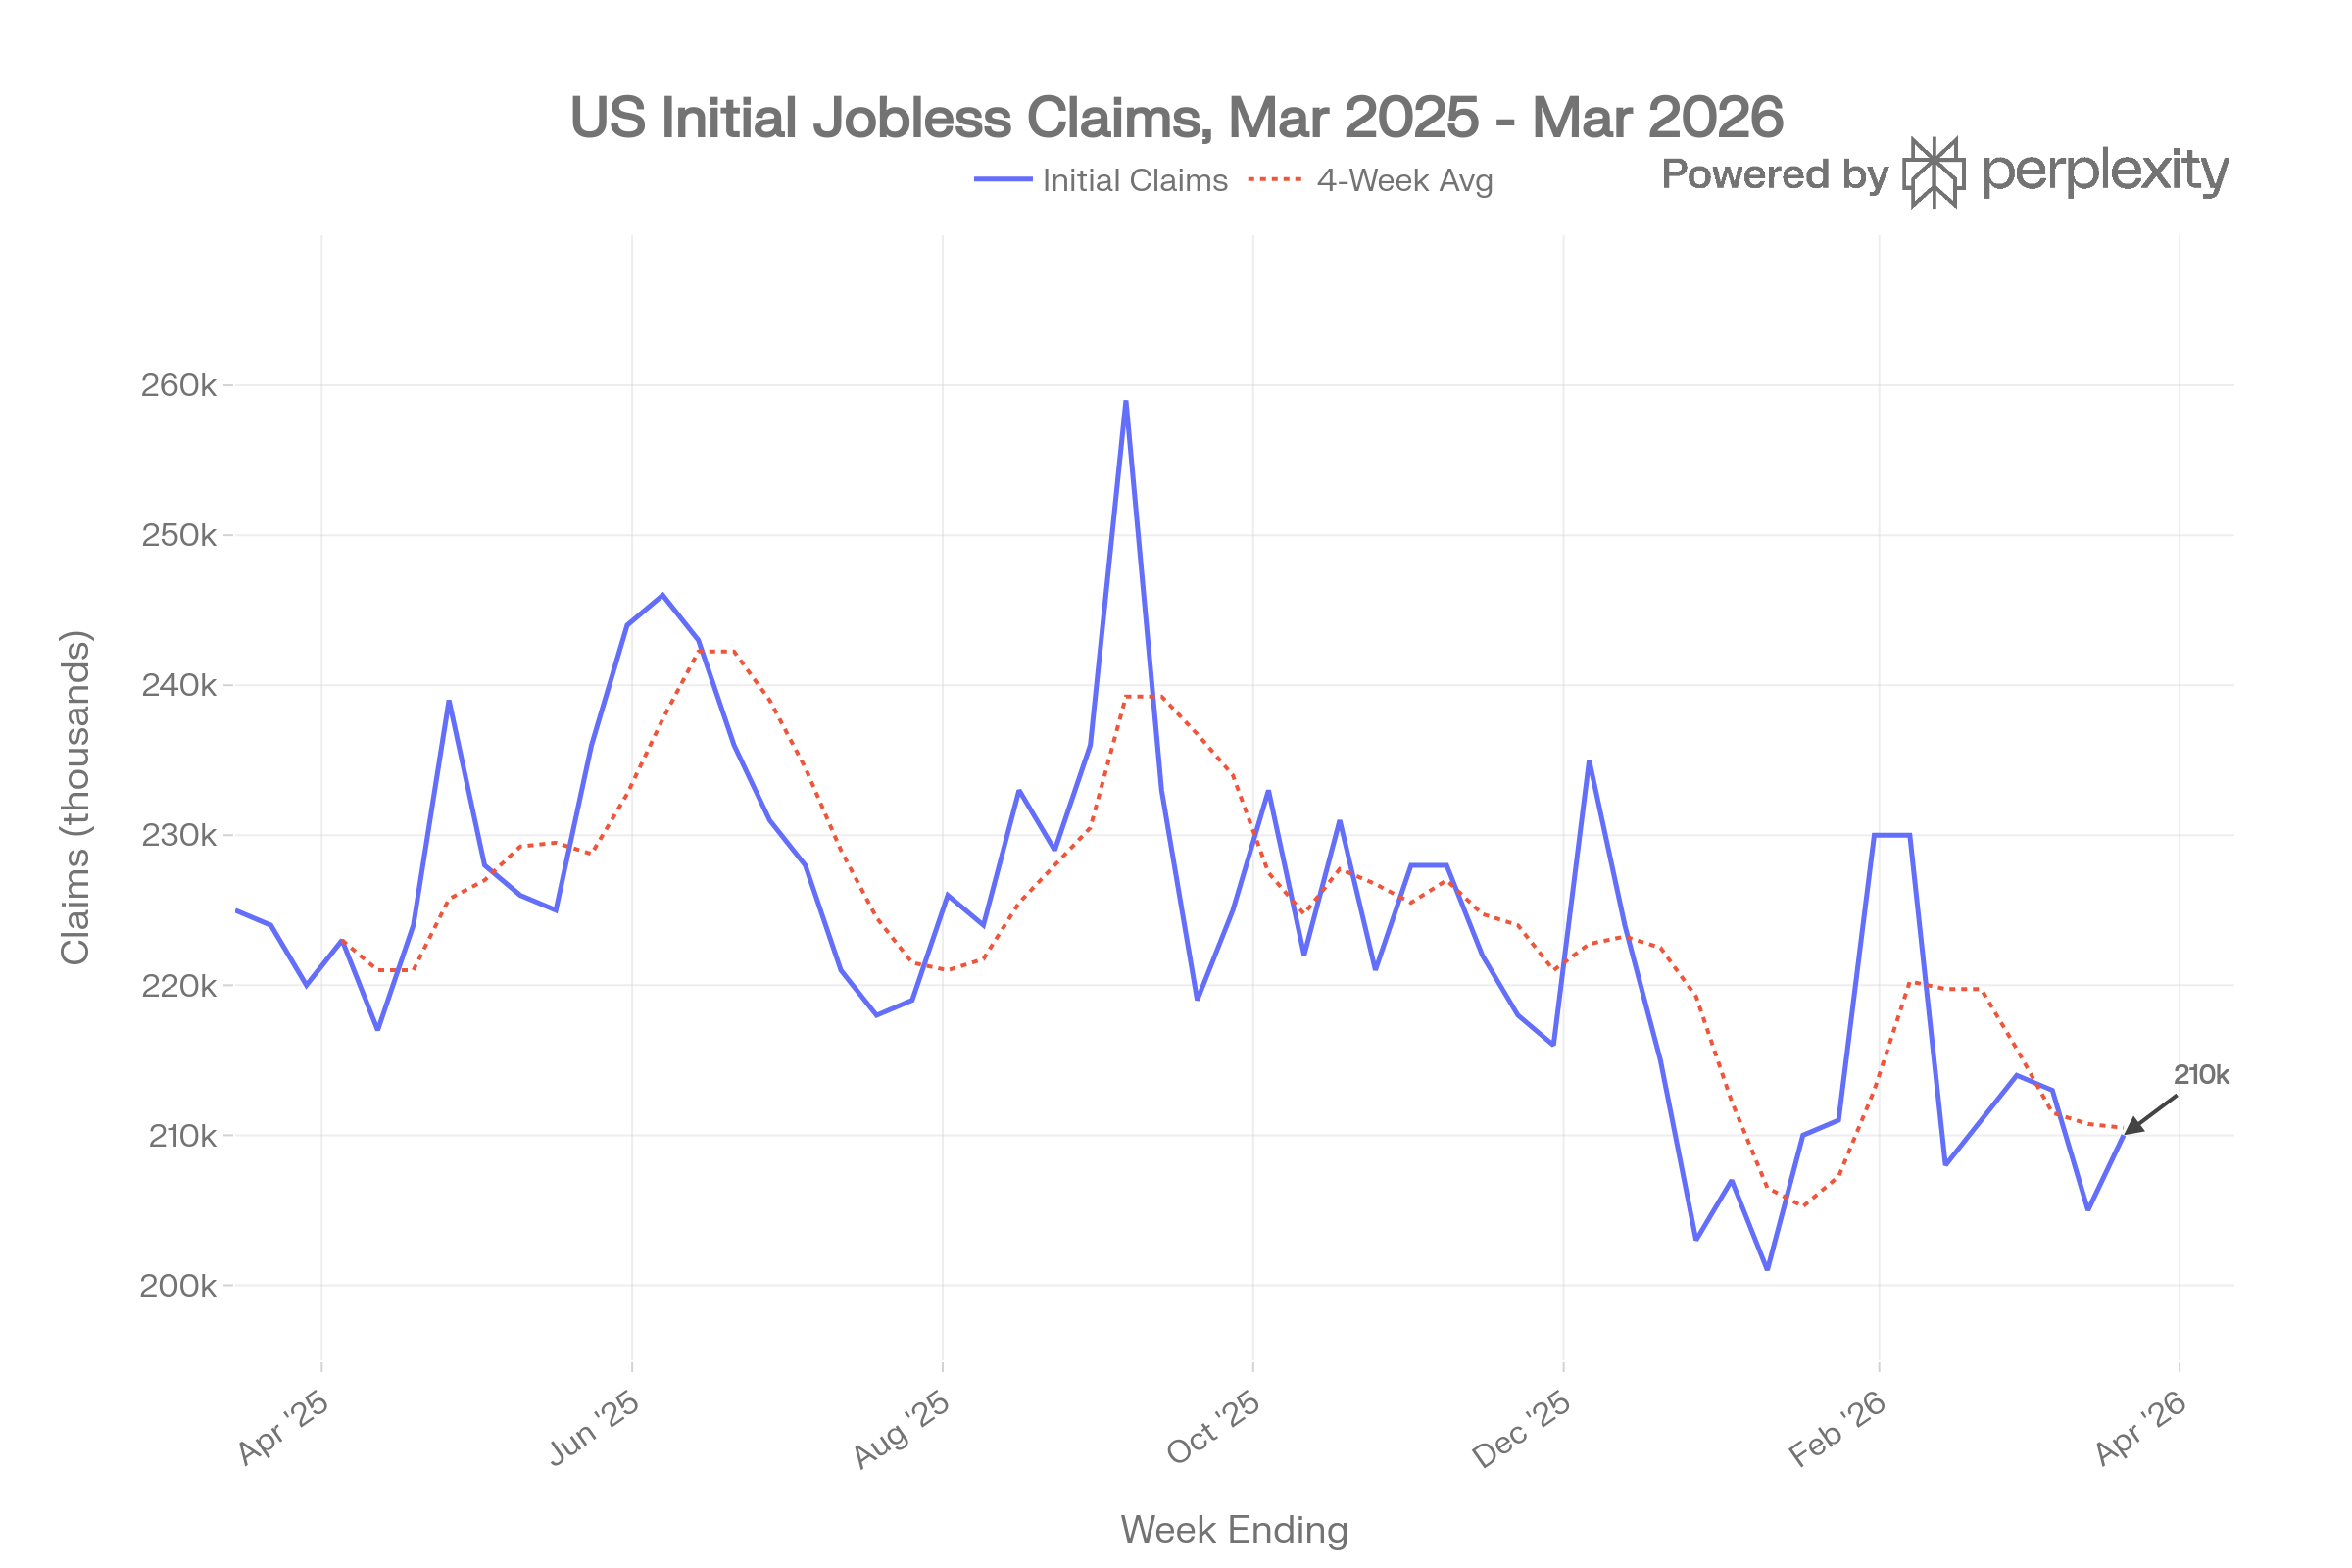
Continuing claims dropped to 1.819 million, the lowest since May 2024. The labor market is stable, but hiring has slowed meaningfully. Friday’s payroll report will be a key data point. Consensus expects around 51,000 new jobs in March and an unchanged unemployment rate. A soft number here would add another layer of concern to the economic picture.
The Fed’s Difficult Position
The Fed is caught between rising inflation and slowing growth.
At the March meeting, most members still projected a rate cut this year, but markets are now pricing a small probability of a rate hike if energy prices stay elevated.
Headline CPI is expected to spike to around 3.5% year-over-year in coming months, which would keep the Fed above its 2% target for a sixth consecutive year.
This is a tough spot.
Rate hikes would pressure equities and housing further.
Rate cuts look premature with inflation re-accelerating.
Expect the Fed to stay on hold and watch the data closely.
Sector Read
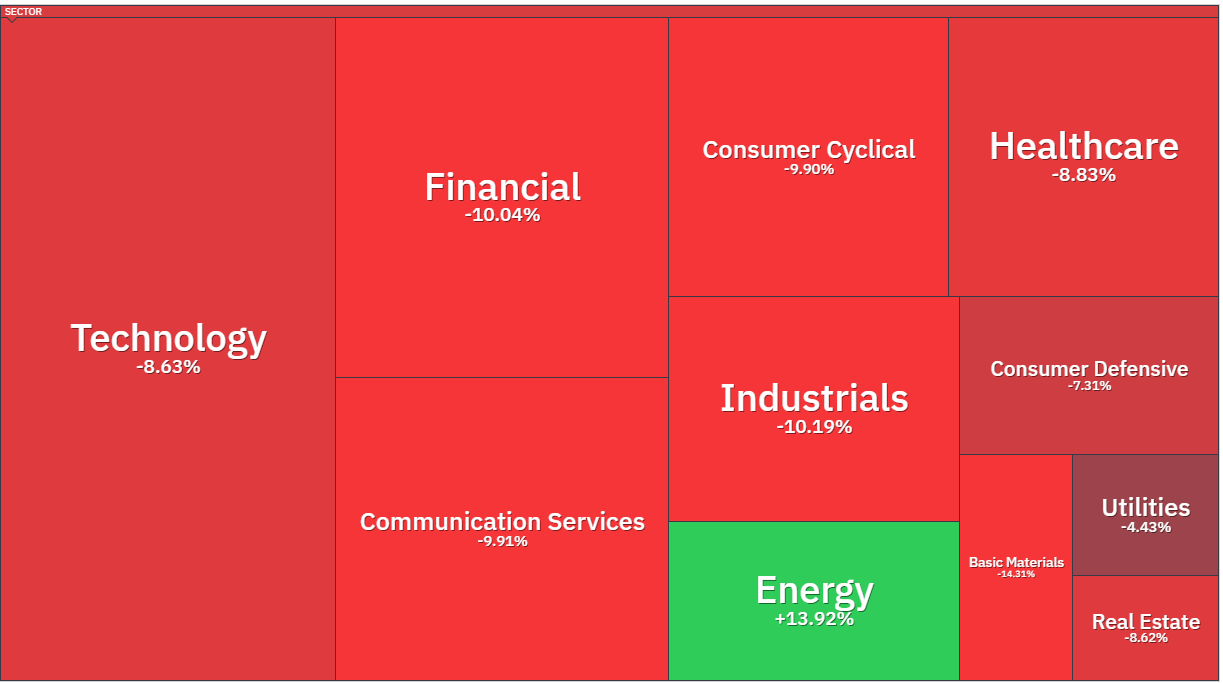
Energy is the clearest beneficiary of the Iran situation.
Defensive sectors like utilities are seeing rotation as investors reduce risk.
Technology and communication services remain under pressure. The divergence between 1-week and 1-month basic materials performance reflects just how fast sentiment has shifted.
Our Dashboard
All three SPX timeframes, short, medium, and long term, are in defensive territory. Every major index tracked on our 21 EMA model (NDX, Dow, Russell, BTC/USD) is printing a red arrow.
The only green signal is the DXY (U.S. Dollar), which makes sense: flight to safety trades are working, and the dollar benefits in risk-off environments.
Stock vs. bond returns show bonds outperforming stocks on a 200-day basis, score of 5.04. That is not a signal to chase bonds aggressively, but it is a signal that the stock-bond correlation has shifted. Bonds are doing their job as a hedge again.
What to Do With This
Respect what the data is showing right now. Elevated VIX, deteriorating breadth, negative PMI trends, weakening consumer sentiment, and geopolitical uncertainty do not create favorable conditions for aggressive long positioning.
If you are a swing trader, your edge comes from selecting the right side of the market at the right time.
This week, the right posture is defense. Reduce size, protect capital, and wait for clearer setups.
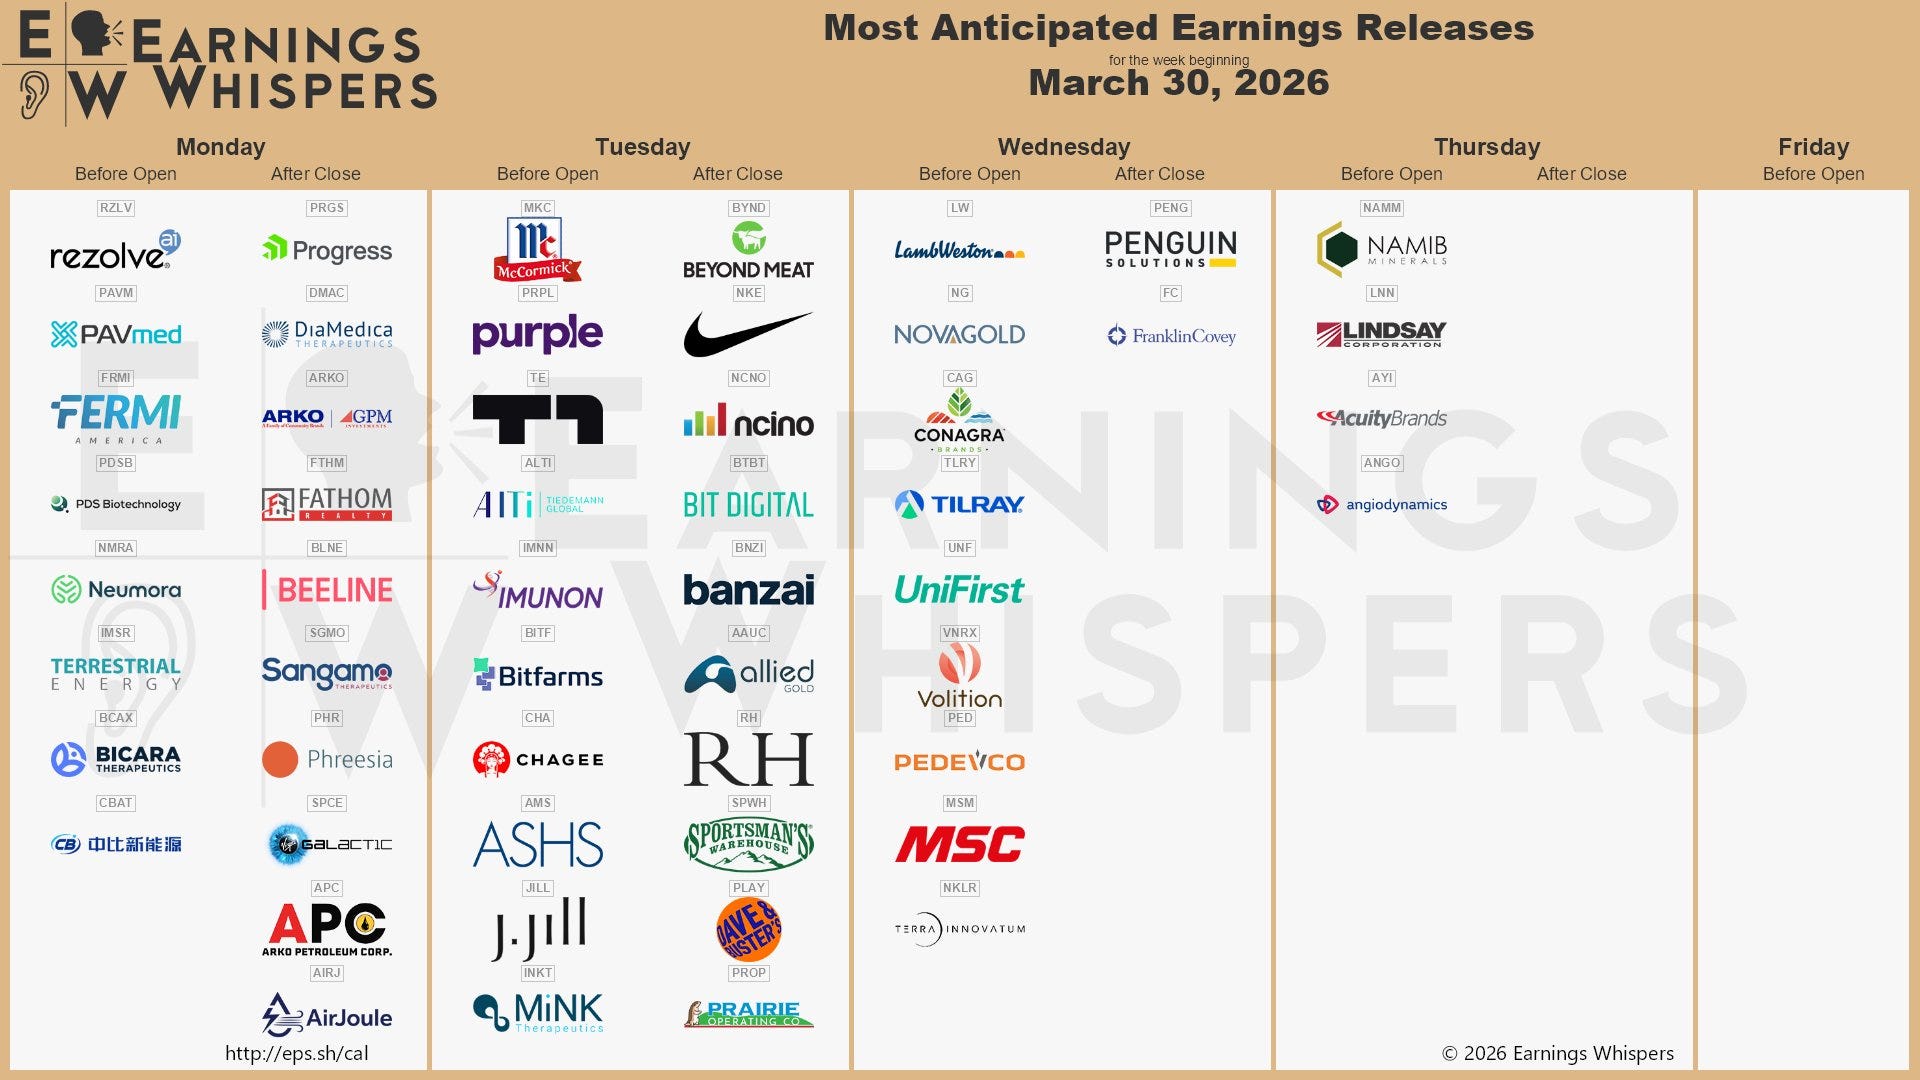
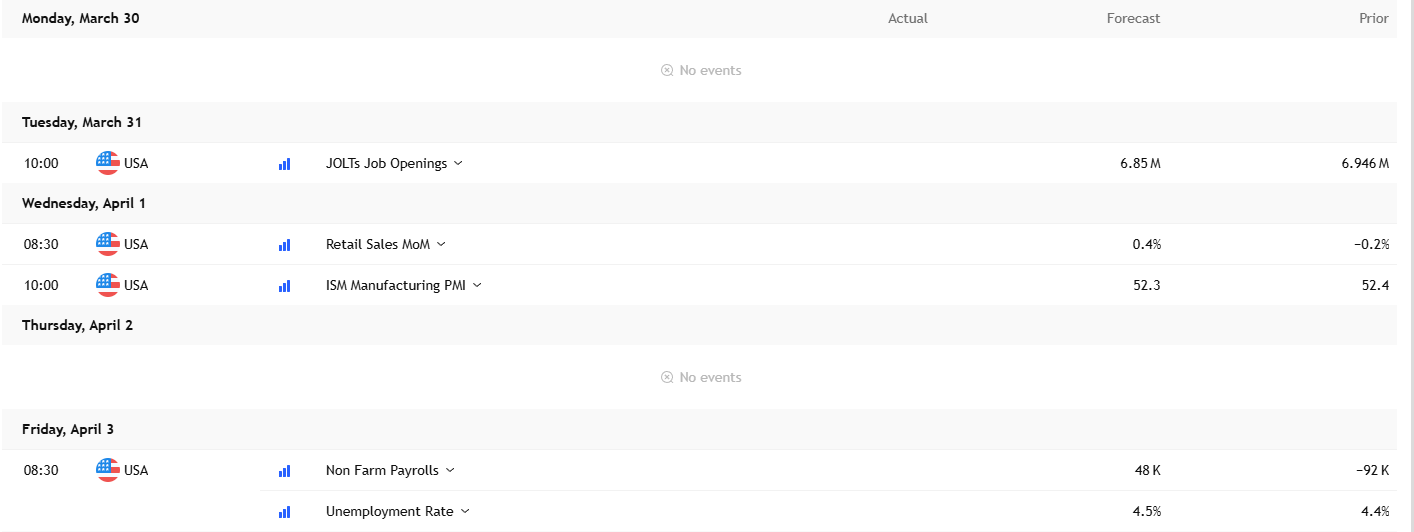
Earnings and Economic Events
This week, the following companies report earnings:
The week ahead is light until Friday, when Non-Farm Payrolls take center stage, with consensus expecting 48K new jobs after last month's alarming -92K print, while the unemployment rate is forecast to tick up to 4.5%.
In a market already pricing elevated fear, a weak payroll number on April 3 could be the catalyst that pushes sentiment from extreme fear into full capitulation.
High Probability Trades
You can find my full watchlist here:
https://www.tradingview.com/watchlists/325756420/
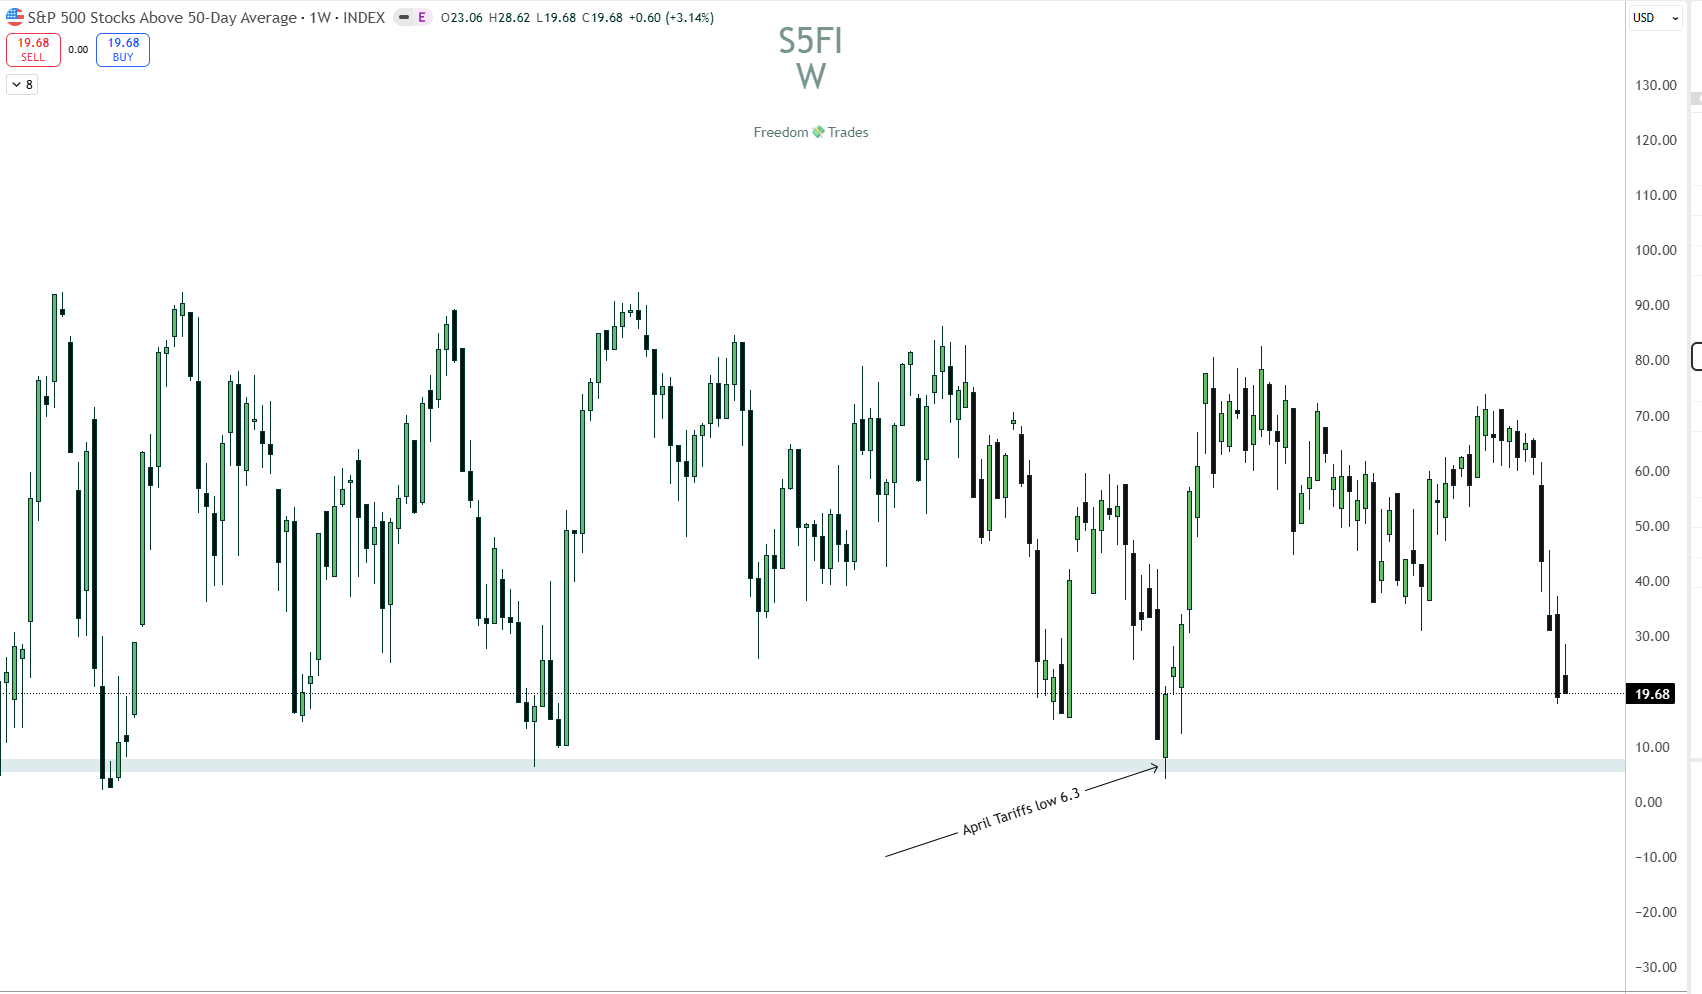
If we look at the S&P 500 stocks above the 50-day average to assess market breadth, we can see that we’re very close to the low created on April 7, 2025, during the situation with the tariffs/Liberation Day.
If we look at how many stocks are above the 200-day average on the S&P 500, we can see that the situation is different, and there’s still plenty of room to the downside before reaching a bottom.
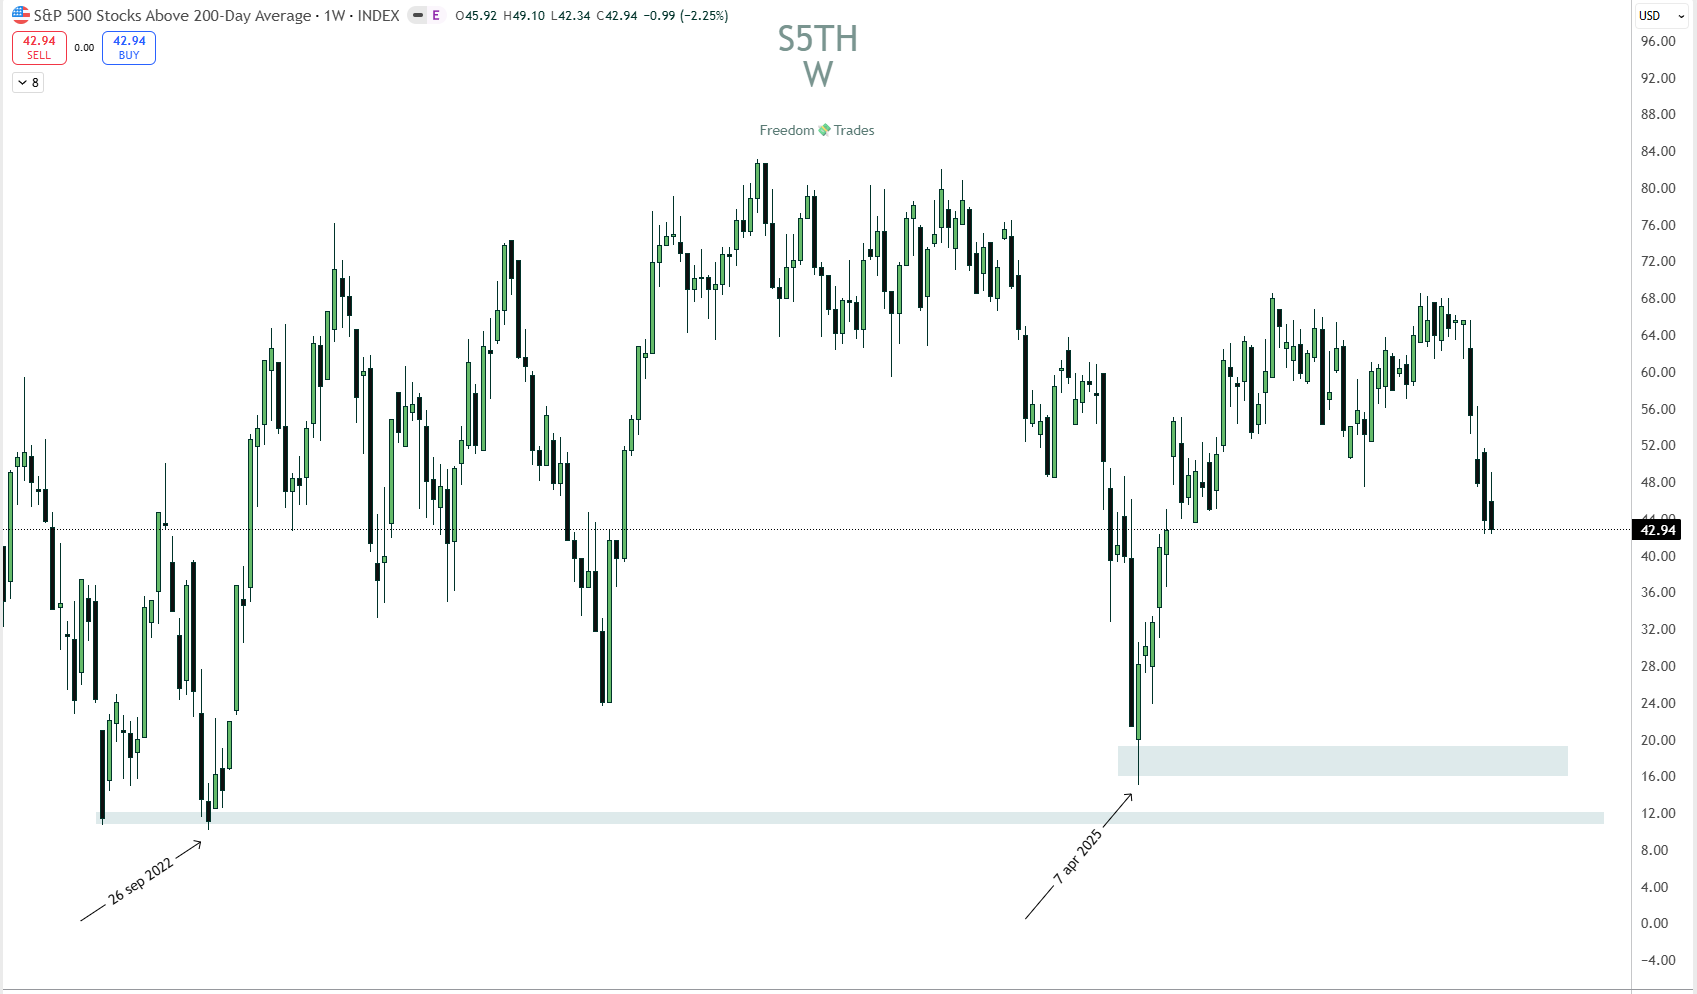
So, what this chart suggests to me is that we might see a short-term local bottom, followed by a retest of that level on $SPY around the 200MA, to see if we can reclaim the price above the 200MA. If not, we’ll likely continue lower in search of support around 6200–6300.
That’s why next week I’ll be very selective, and if I open any positions, I’ll mainly look for short setups, holding trades for a maximum of 1–3 days and taking profits more quickly.
Ticker: APA
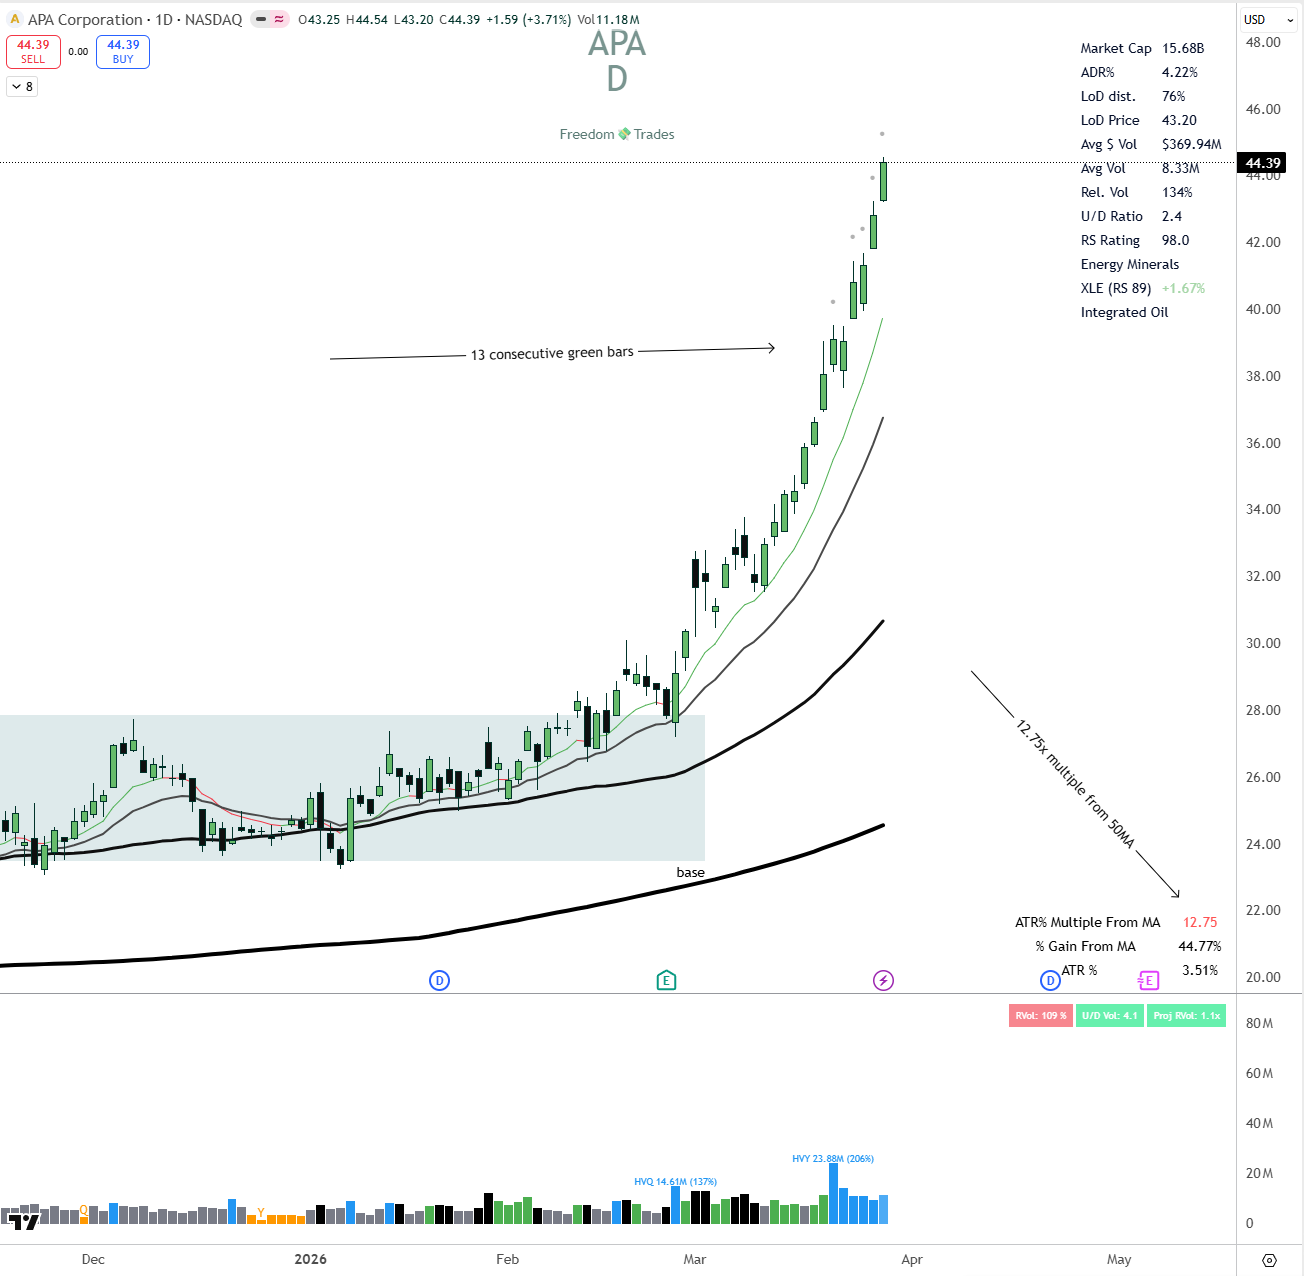
This ticker is one of the beneficiaries of the ongoing conflict between the US, Israel, and Iran, as it’s operating in the right industry and sector: Energy / Integrated Oil.
However, after 13 consecutive green bars, we can’t help but wonder what the probability is for this stock to continue such an explosive move. The risk/reward is starting to skew in our favor.
Also, the ATR% multiple from the 50MA is at 12.75, which shows the stock is way too overextended. Of course, that doesn’t make this trade 100% safe, but you should always think risk-to-reward first.
Also, consider what would happen to this stock if the conflict were to end or if any positive signs toward resolution appear, it would likely drop significantly.
So the way I’d play this is by taking a 5-min ORB with a stop at HOD, using small risk for a potentially big winner. For now, I wouldn’t hold this position overnight, as this is strictly an intra-day trade.
Ticker: Q
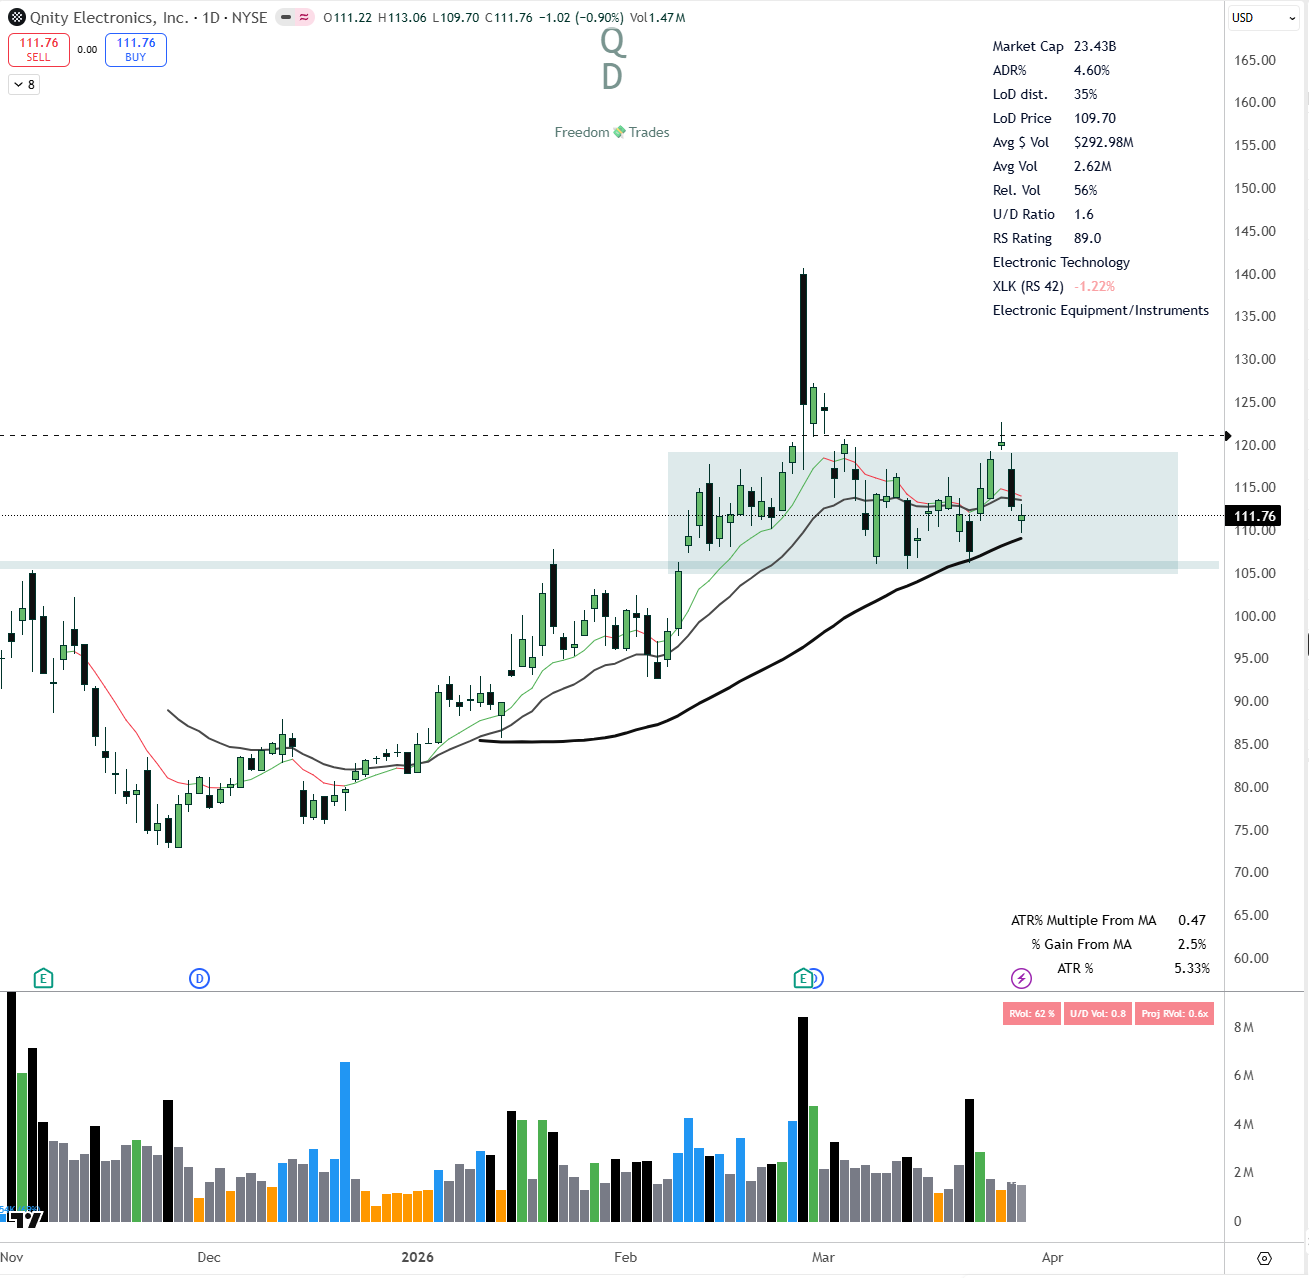
Considering how poorly the market has performed in recent months, this stock has held up surprisingly well. It has shown relative strength, and in the past three months, it’s up 34%.
This could be an IPO play. After the price action formed a U-shape, the stock now seems to be stabilizing and forming a base. I believe at the first sign of price stabilization, this stock could explode higher.
It has strong average dollar volume, around $300 million, which suggests solid institutional and big money interest, along with a market cap of $23 billion.
It’s also positioned in the right sector, focused on solutions for the future. This stock has the potential to be a 100–200% winner.
Other interesting tickers you should keep an eye on:
SM (for a short)
I encourage you, if you’re already a PRO member, you can upgrade your membership on the Discord server (at no extra cost) and get access to a fully private server dedicated to PRO members, for networking, trade ideas, insights, and alerts. (I am wayyy more active there than the Substack chat)
Connect PRO account with discord server
P.S.: The email you use on Discord must be the same as the one on Substack.
Please be aware that there are scammers impersonating me. Remember that I will never contact you personally, nor will I ask you to sign up with different brokers/extra services. Never share any personal information!! Please stay safe. Always double check or ask in the public chat if you are not sure that it is me or if a link is safe.
All the positions I take during the week can be found on the Discord server or in the Freedom Trades private chat.
“One trade closer to freedom”
Vladislav