

High-Probability Trades for This Week
High Probability Trades for 2 - 6 February 2026 | Edition 28

This is the current value of my swing trading account.
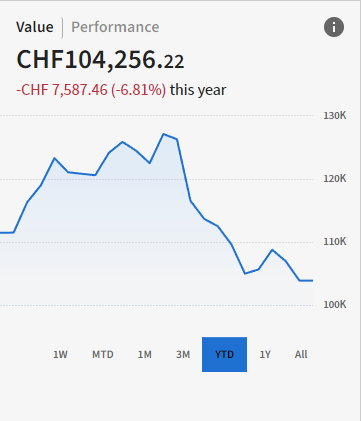
Attention: since I live in Switzerland, the currency is set in CHF (which means if you convert it to USD, the amount is higher).
To better understand the strategy we are following and not to buy blindly without any context, please read and analyze my strategy carefully:

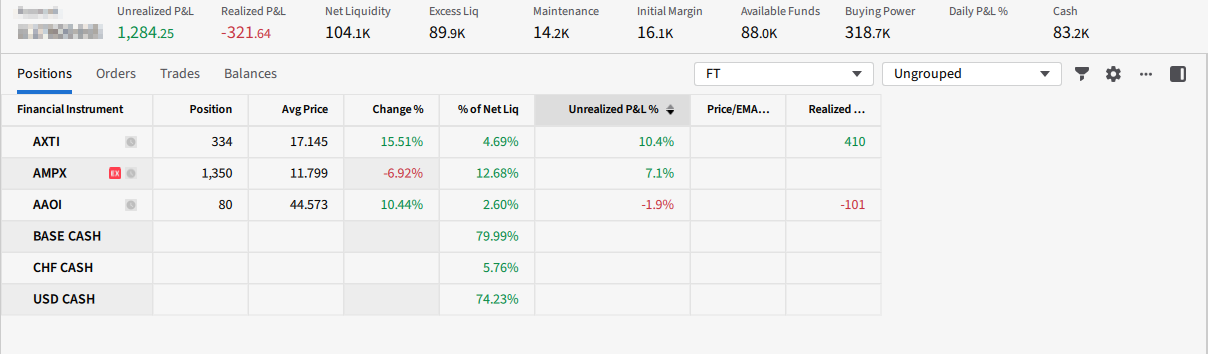
Right now, these are my positions:
Dear Traders,
The first month of the year is done and wow, what a month it was. If you’re positive on the month, give yourself credit, you did a great job, because the environment was choppy and breakouts barely worked. Most of them would gap up and fade by the end of the day. That kind of tape is death by a thousand cuts.
I expect my monthly performance review to be ready by the end of next week.
I want to encourage you to read it and actually study it, because there’s something interesting in there: my monthly P&L is positive even though I know my execution was not great.
And that leads to a valuable lesson I had to learn the hard way too: the monthly P&L doesn’t tell the full story.
That’s why it’s easy to get fooled online when you see traders making money month after month. You don’t know what risk settings they used. You don’t know if they carried unrealized profits and only realized them that month, exactly like I did.
There are a lot of details you simply cannot know unless you can see their trading journal.
Now, before we start, one last thing: tomorrow I’m going to share the scanners I use to find all my trading ideas. Save them and plug them into your process.
Weekly Market Direction
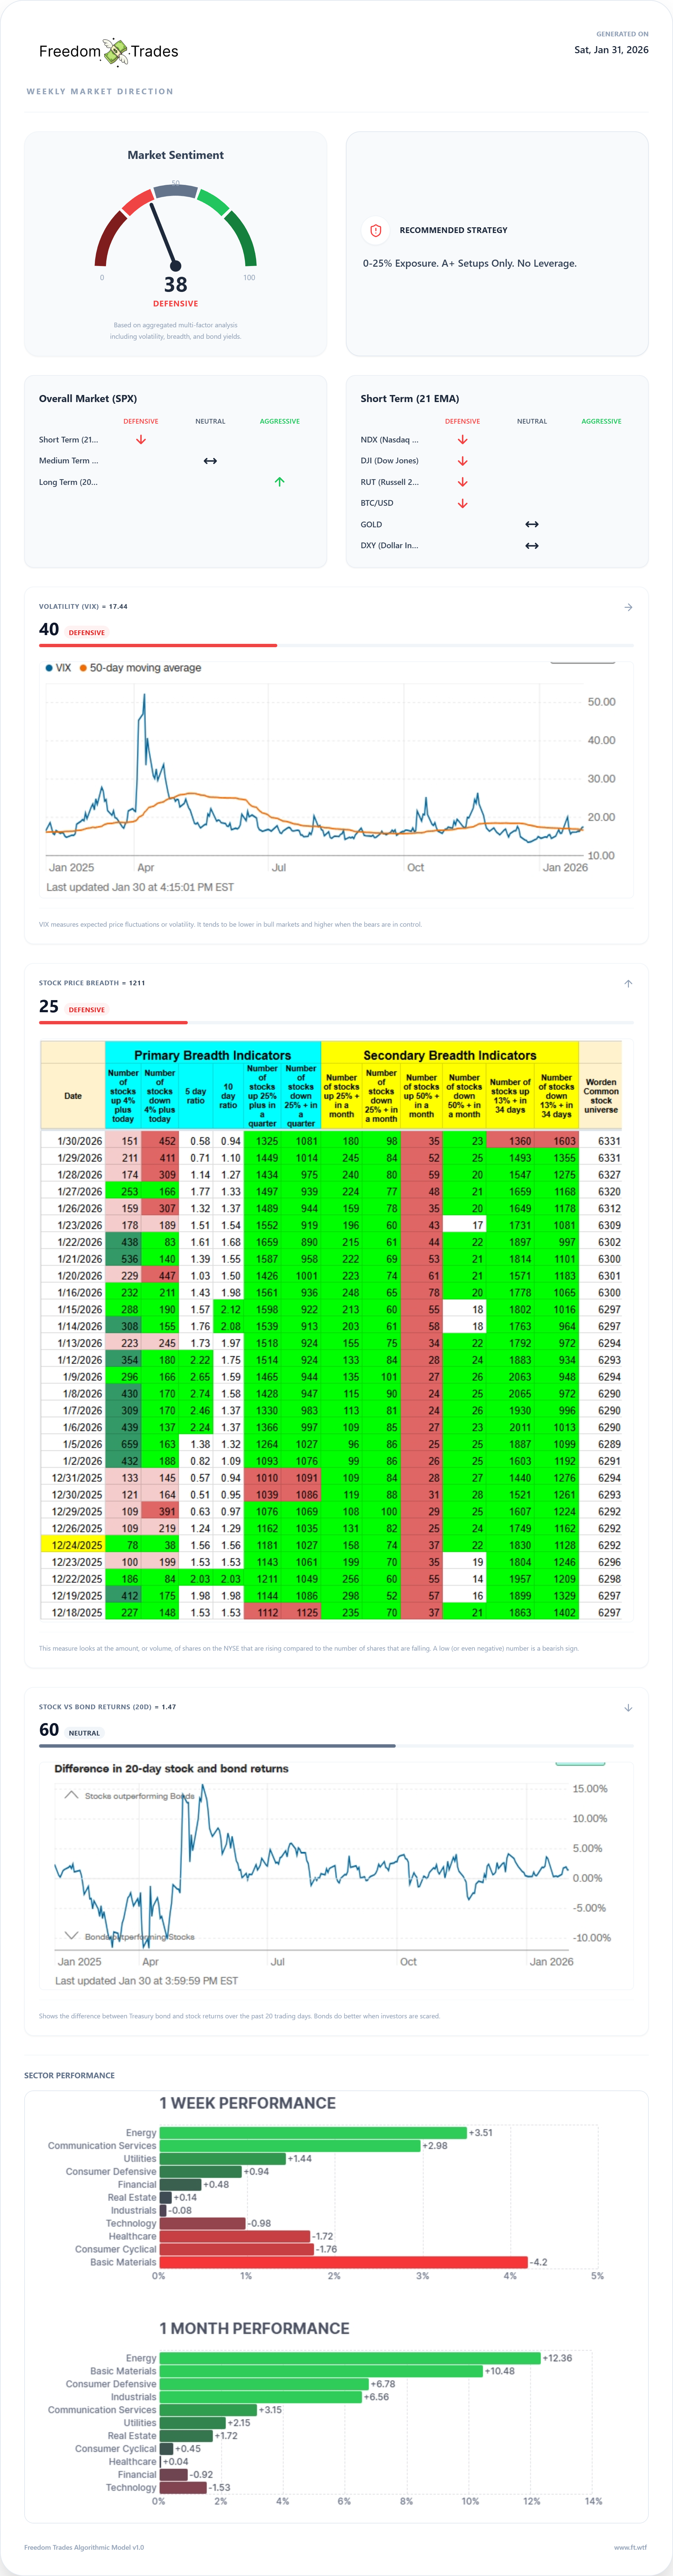
The dashboard stays defensive, even while the big trend still looks up.
This week, the market pushed the S&P 500 above 7,000 intraday, then pulled back from that fresh high. That kind of move usually means buyers are present, but they are also quick to take profits.
The dashboard’s headline read is clear: Market Sentiment is 38, Defensive. With that score, the model’s guidance stays tight and disciplined: 0% to 25% exposure, A+ setups only, and no leverage. The goal is to participate only when the odds are clean, and to avoid getting chopped up when conditions are mixed.
Under the surface, the trend picture explains why the model is cautious. For the S&P 500, the dashboard shows short-term Defensive, medium-term Neutral, and long-term Aggressive. That combination matters. A strong long-term trend can still exist, but short-term weakness often creates messy pullbacks, fake breakouts, and sudden reversals.
Volatility also fits the same story. The dashboard shows VIX at 17.84 with a Volatility score of 40, Defensive. A VIX in this zone often produces a market that drifts, then snaps, then drifts again.
Breadth is the biggest warning this week. The dashboard’s breadth score is 25, Defensive, which means participation is weak. The clearest example is the latest day in the table: on 1/30/2026, only 151 stocks were up 4% or more, while 452 stocks were down 4% or more. It suggests downside moves are broader and more aggressive than upside moves. In markets like this, index strength can be carried by a smaller group of names, while the average stock struggles.
Zooming out to one month, Energy is up +12.36%, Basic Materials +10.48%, Consumer Defensive +6.78%, Industrials +6.56%, and Communication Services +3.15%. Meanwhile, Technology is down -1.53% and Financials -0.92%.
It supports the dashboard’s stance: strong long-term trend, but leadership is rotating and short-term conditions are not smooth.
Macro data also pushed the tape toward caution. The Conference Board consumer confidence index fell to 84.5 in January from 94.2, the lowest level since May 2014. That is a sharp drop, and it points to softer mood and softer expectations. At the same time, the labor market did not crack. Weekly jobless claims came in at 209,000 (vs 210,000 the week before), and continuing claims fell to about 1.83 million, the lowest since September 2024.
In other words: confidence is slipping, but employment data still looks stable.
Inflation signals were not fully friendly. Producer prices rose 0.5% month over month in December (above the 0.2% expected). Services were a big driver, up 0.7%, and margins at wholesalers and retailers rose 1.7%.
The rate story stayed steady too. The Federal Reserve held the fed funds target at 3.50% to 3.75%, with a 10 to 2 vote. Two voters wanted a 0.25% cut, but the majority preferred to wait. Chair Jerome Powell signaled a meeting-by-meeting approach, and also suggested policy is not “significantly restrictive” right now. On the political side, Donald Trump announced he nominated Kevin Warsh to succeed Powell when the chair term ends in May 2026.
With that said, the recommendation is to keep risk small. The goal in this period is to protect capital, and when the right moment comes, we will push and put our buying power to work.
High Probability Trades
You can find my full watchlist here:
https://www.tradingview.com/watchlists/318873606/
A lot of tickers are starting to look more like high-quality shorts than clean longs. Because of that, I’ll be hesitant to share too many ideas. As momentum traders, we want to buy stocks that have proven they deserve to be bought.
Right now, most stocks are below the 20-day moving average and are testing the 50-day. Some are even testing the 200-day, like SOFI and HOOD.
So please be very cautious and only buy when a stock is clearly showing strength.
Also, price action this week will depend heavily on what happens during earnings season.
This week, the following companies report earnings:
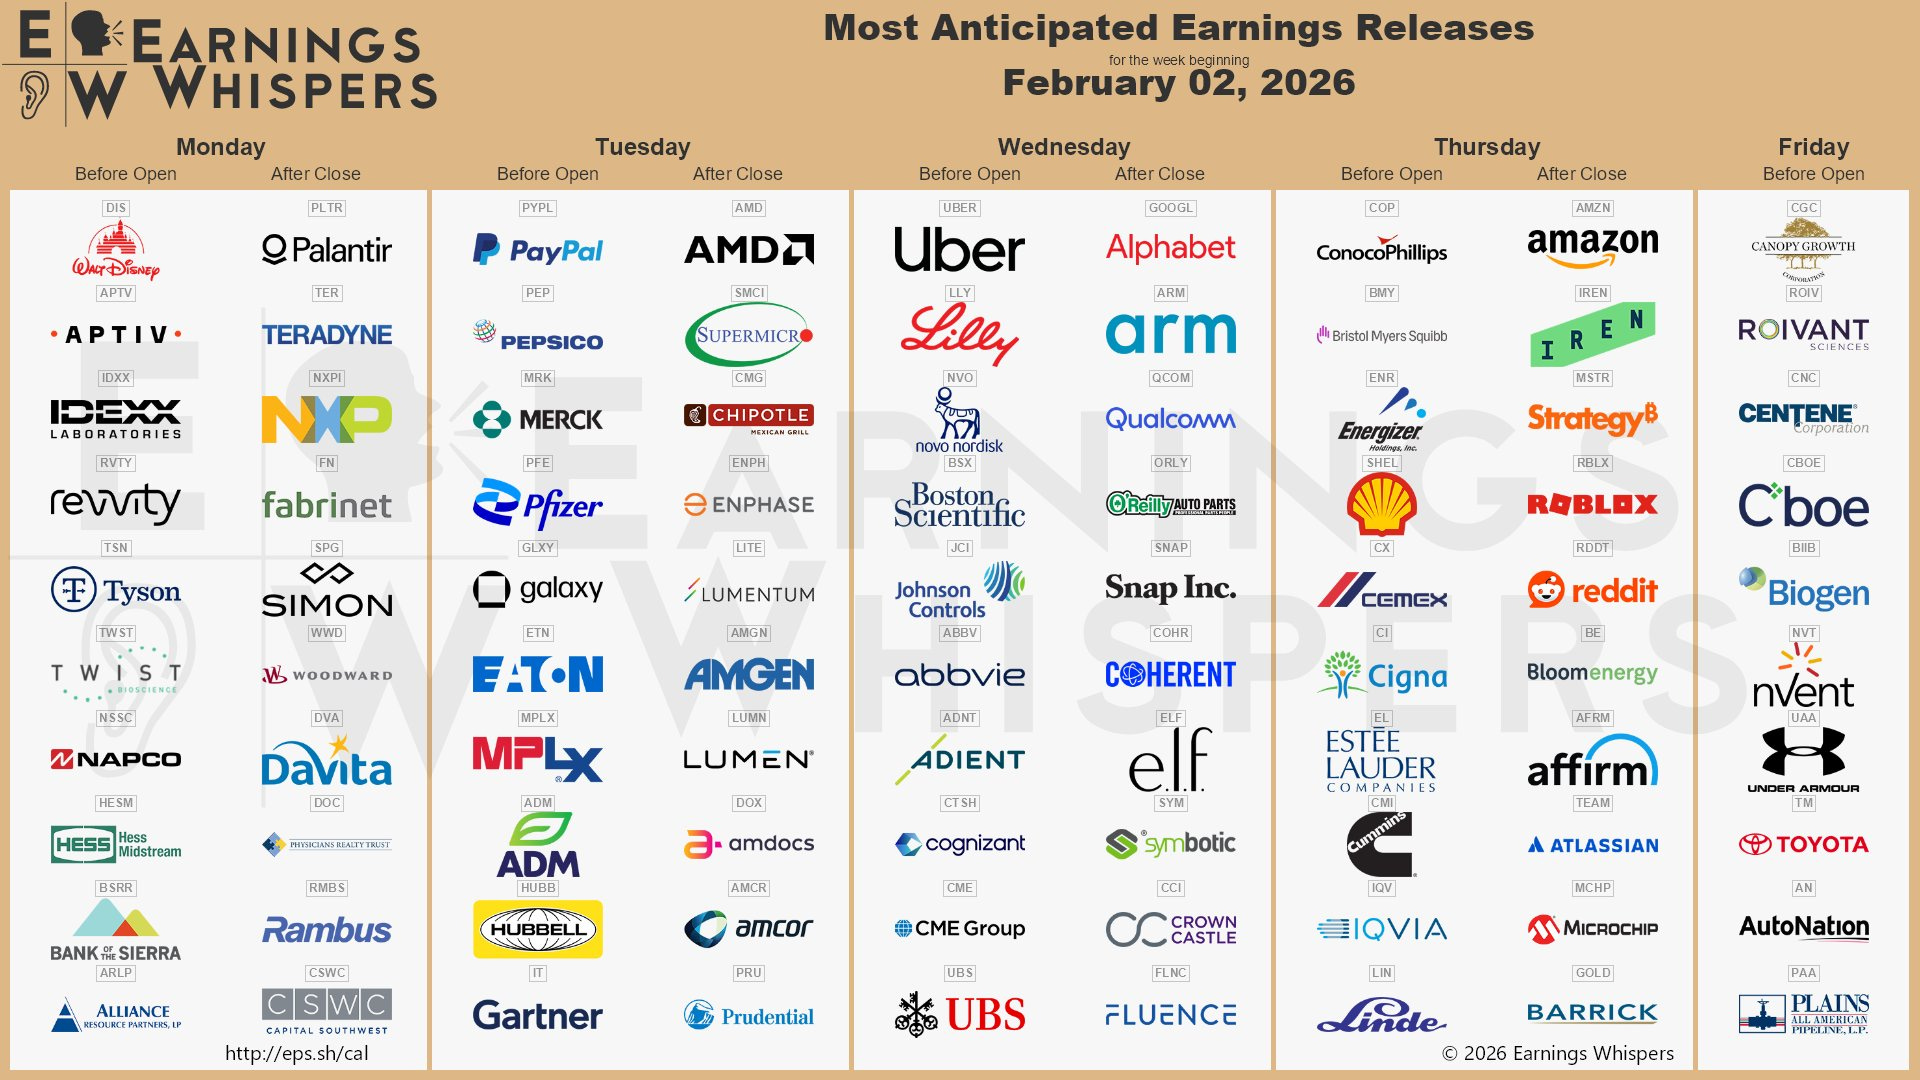
Big companies like DIS, PLTR, AMD, PYPL, UBER, GOOGL, LLY, AMZN, they all report this week.
Ticker: GLW
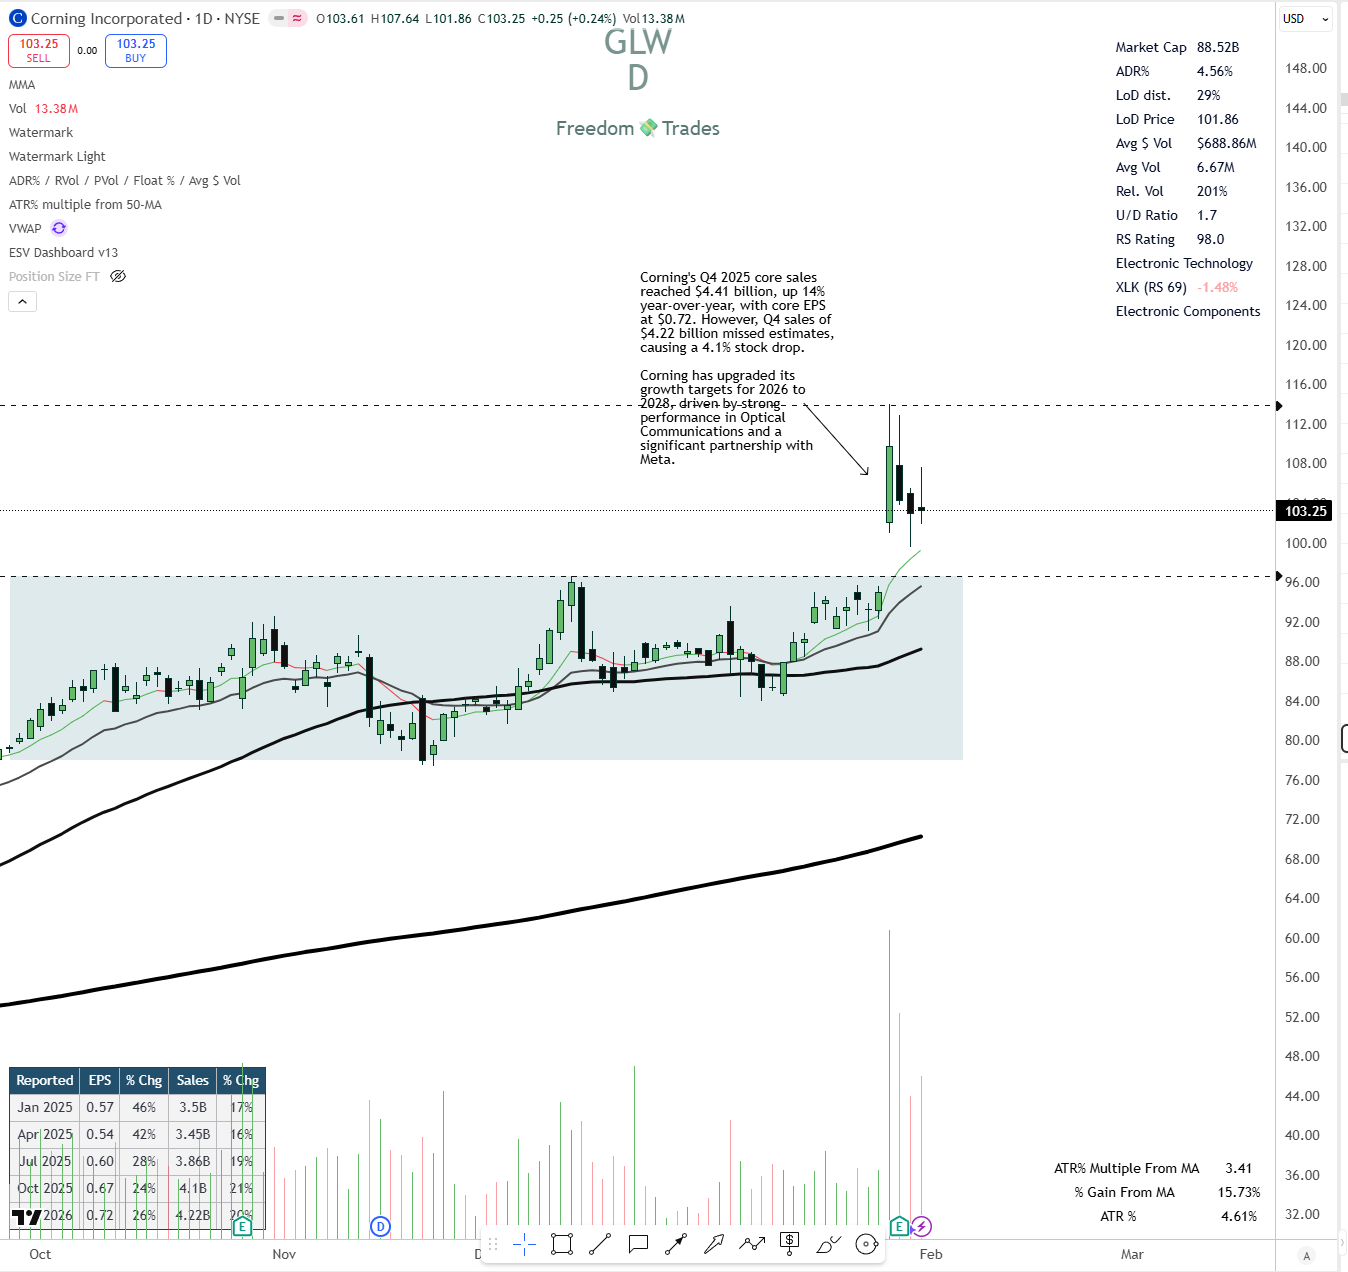
I like GLW because they recently announced a partnership with Meta (a positive catalyst). They also reported earnings, and while the quarter wasn’t amazing, it wasn’t bad either, especially since they upgraded their growth targets for 2026 through 2028.
And as you can see, GLW managed to hold its price surprisingly well, despite two red days in the S&P 500 and XLK (the sector it belongs to).
If GLW can keep holding this level and we get some price compression, I’d be interested in buying. I’d place my stop loss at $99 and look to ride the earnings power trend.
Ticker: AXTI
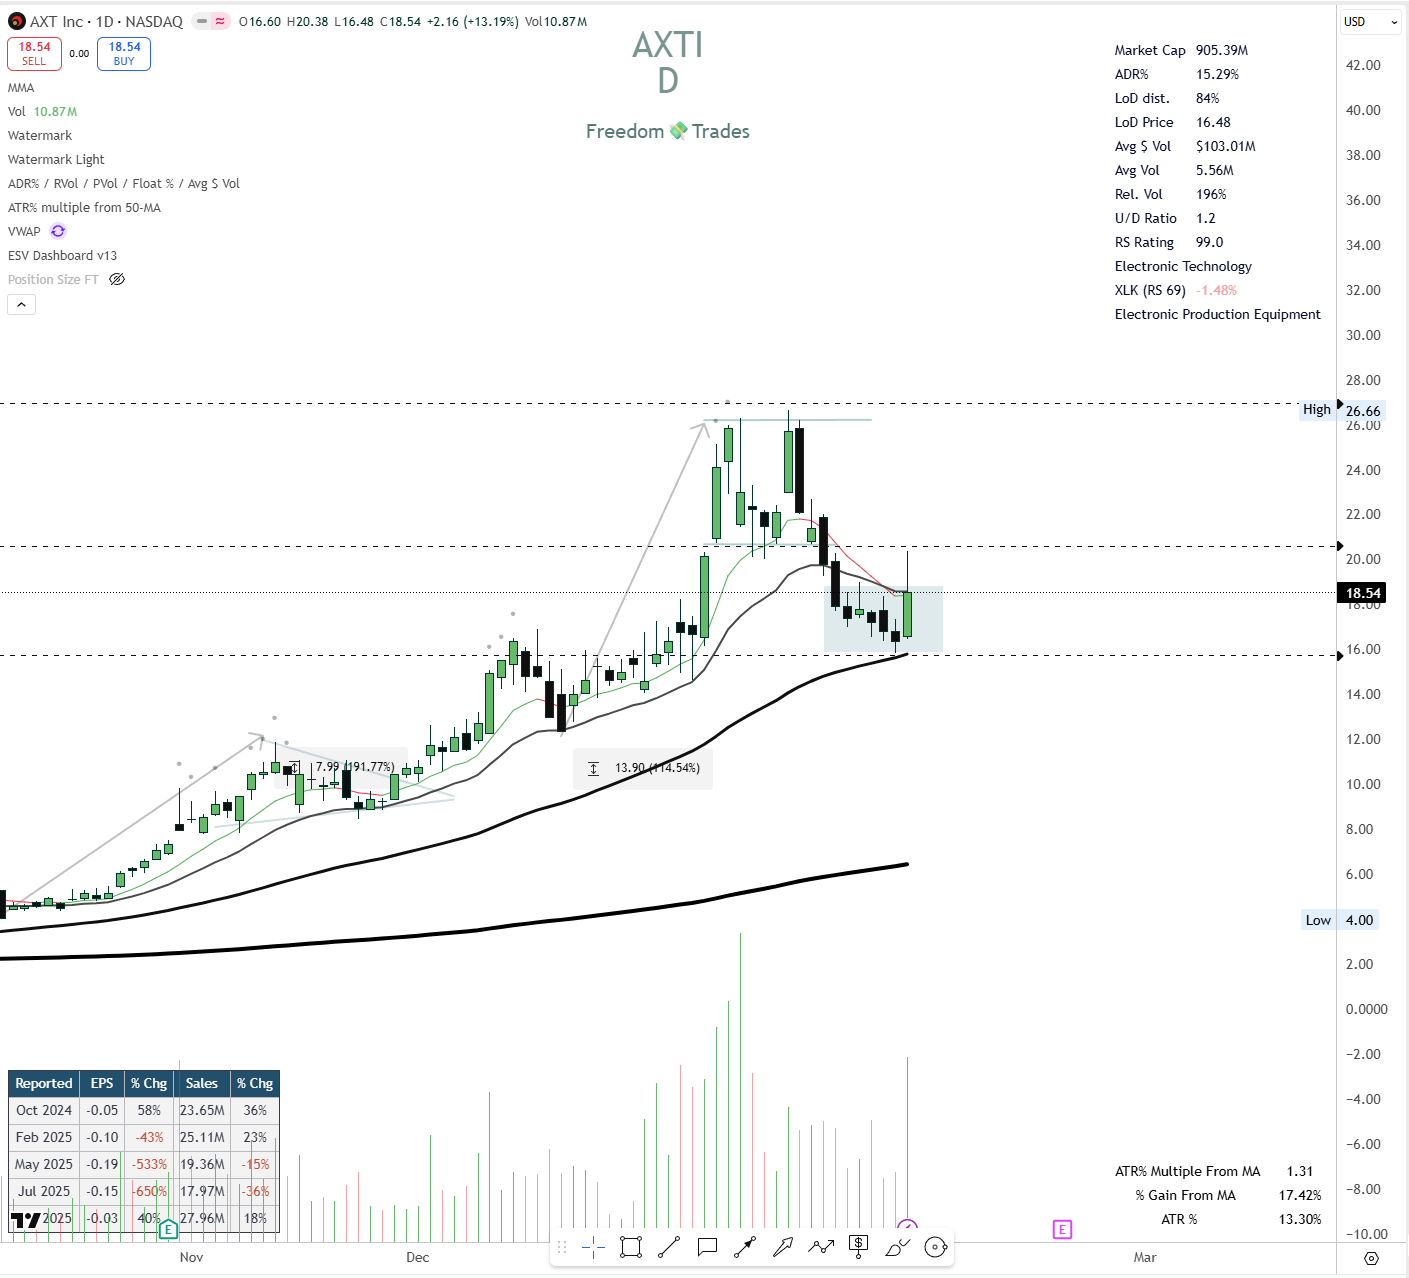
As you know, on Friday I entered AXTI as it exploded at the open with strong volume and momentum. It was up 22% at the high and showed clear relative strength versus the index and its ETFs.
This is a small-cap name at around $900M in market cap, so I’d approach it with caution. But if it can break above and hold the 50-day moving average, it has room to run back toward the prior high around $26, which would represent roughly 40% upside from here.
If market conditions cooperate, we could see more explosive momentum, especially with earnings coming up on February 19.
Other interesting tickers you should keep an eye on:
INOD, WULF, CIFR
Important links to read and understand:
🟢How to define whether a setup is A+, A, or B. (Click here)
I encourage you, if you’re already a PRO member, you can upgrade your membership on the Discord server (at no extra cost) and get access to a fully private server dedicated to PRO members, for networking, trade ideas, insights, and alerts. (I am wayyy more active there than the Substack chat)
Connect PRO account with discord server
P.S.: The email you use on Discord must be the same as the one on Substack.
All the positions I take during the week can be found on the Discord server or in the Freedom Trades private chat.
If you get an error or can’t make it work, message me privately, I might be able to help you out. 🙂
“One trade closer to freedom”
Vladislav