

High Probability Trades for Week 42, 2025
20 - 24 October 2025 | Edition 13

This post is available exclusively to PRO members and contains my interpretation of the watchlist along with the trading opportunities I see for the next week.
To better understand the strategy we are following and not to buy blindly without any context, please read and analyze my strategy carefully:

All the positions I take can be found in the Freedom Trades private chat.
Inside My Portfolio
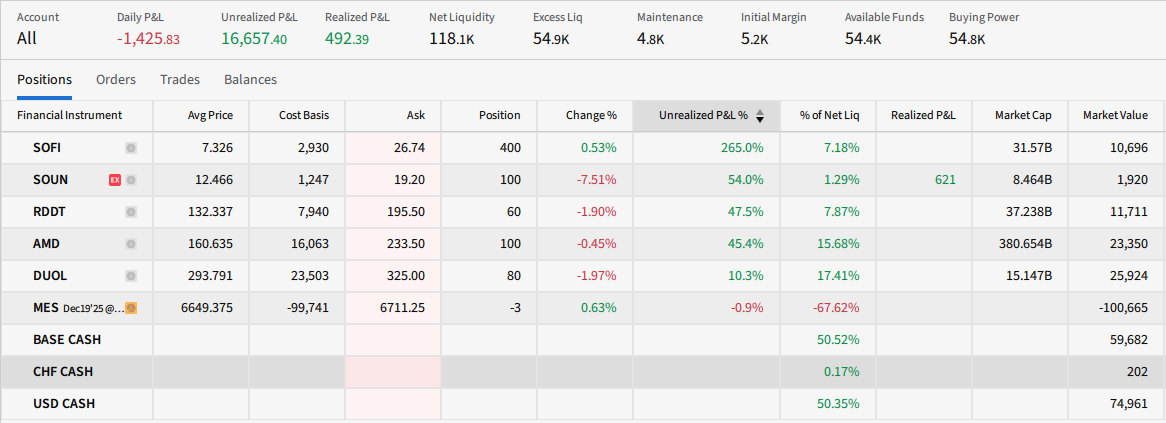
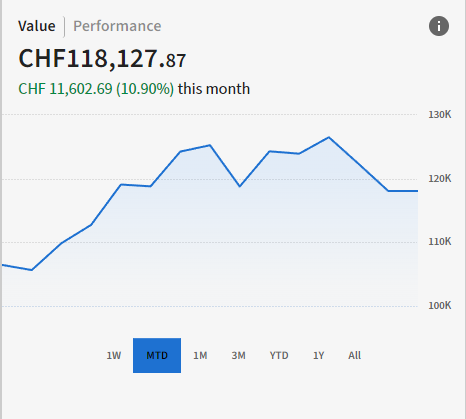
Because you pay for this newsletter monthly, I feel I have the responsibility and duty to be 100% transparent with you. That’s why I’ve introduced this format where I show you every week exactly what my portfolio looks like. (shares, total value of my portfolio, avg price - everything!)
Right now, these are my positions:
Attention: since I live in Switzerland, the currency is set in CHF (which means if you convert it to USD, the amount is higher).
I hope you’ve carefully read the previous post I shared here.
If you haven’t yet, I highly recommend doing so, it will help you understand why some trades are superior to others, how to position yourself better, and how to build more confidence in your decisions.
Here is the link:
How to Find the Next 10x Stock Before They Explode

This post is available exclusively to PRO members.
The purpose of this community will always remain the same:
To make you a better trader.
To build a global trading community united by one goal: Freedom!
Week by week, I’ve been improving this plan, and one day I realized something important:
I never actually told the most important people — you — that things are truly getting better.
So I want to show you a roadmap for this plan, so you can see that with every passing month, it keeps getting better.
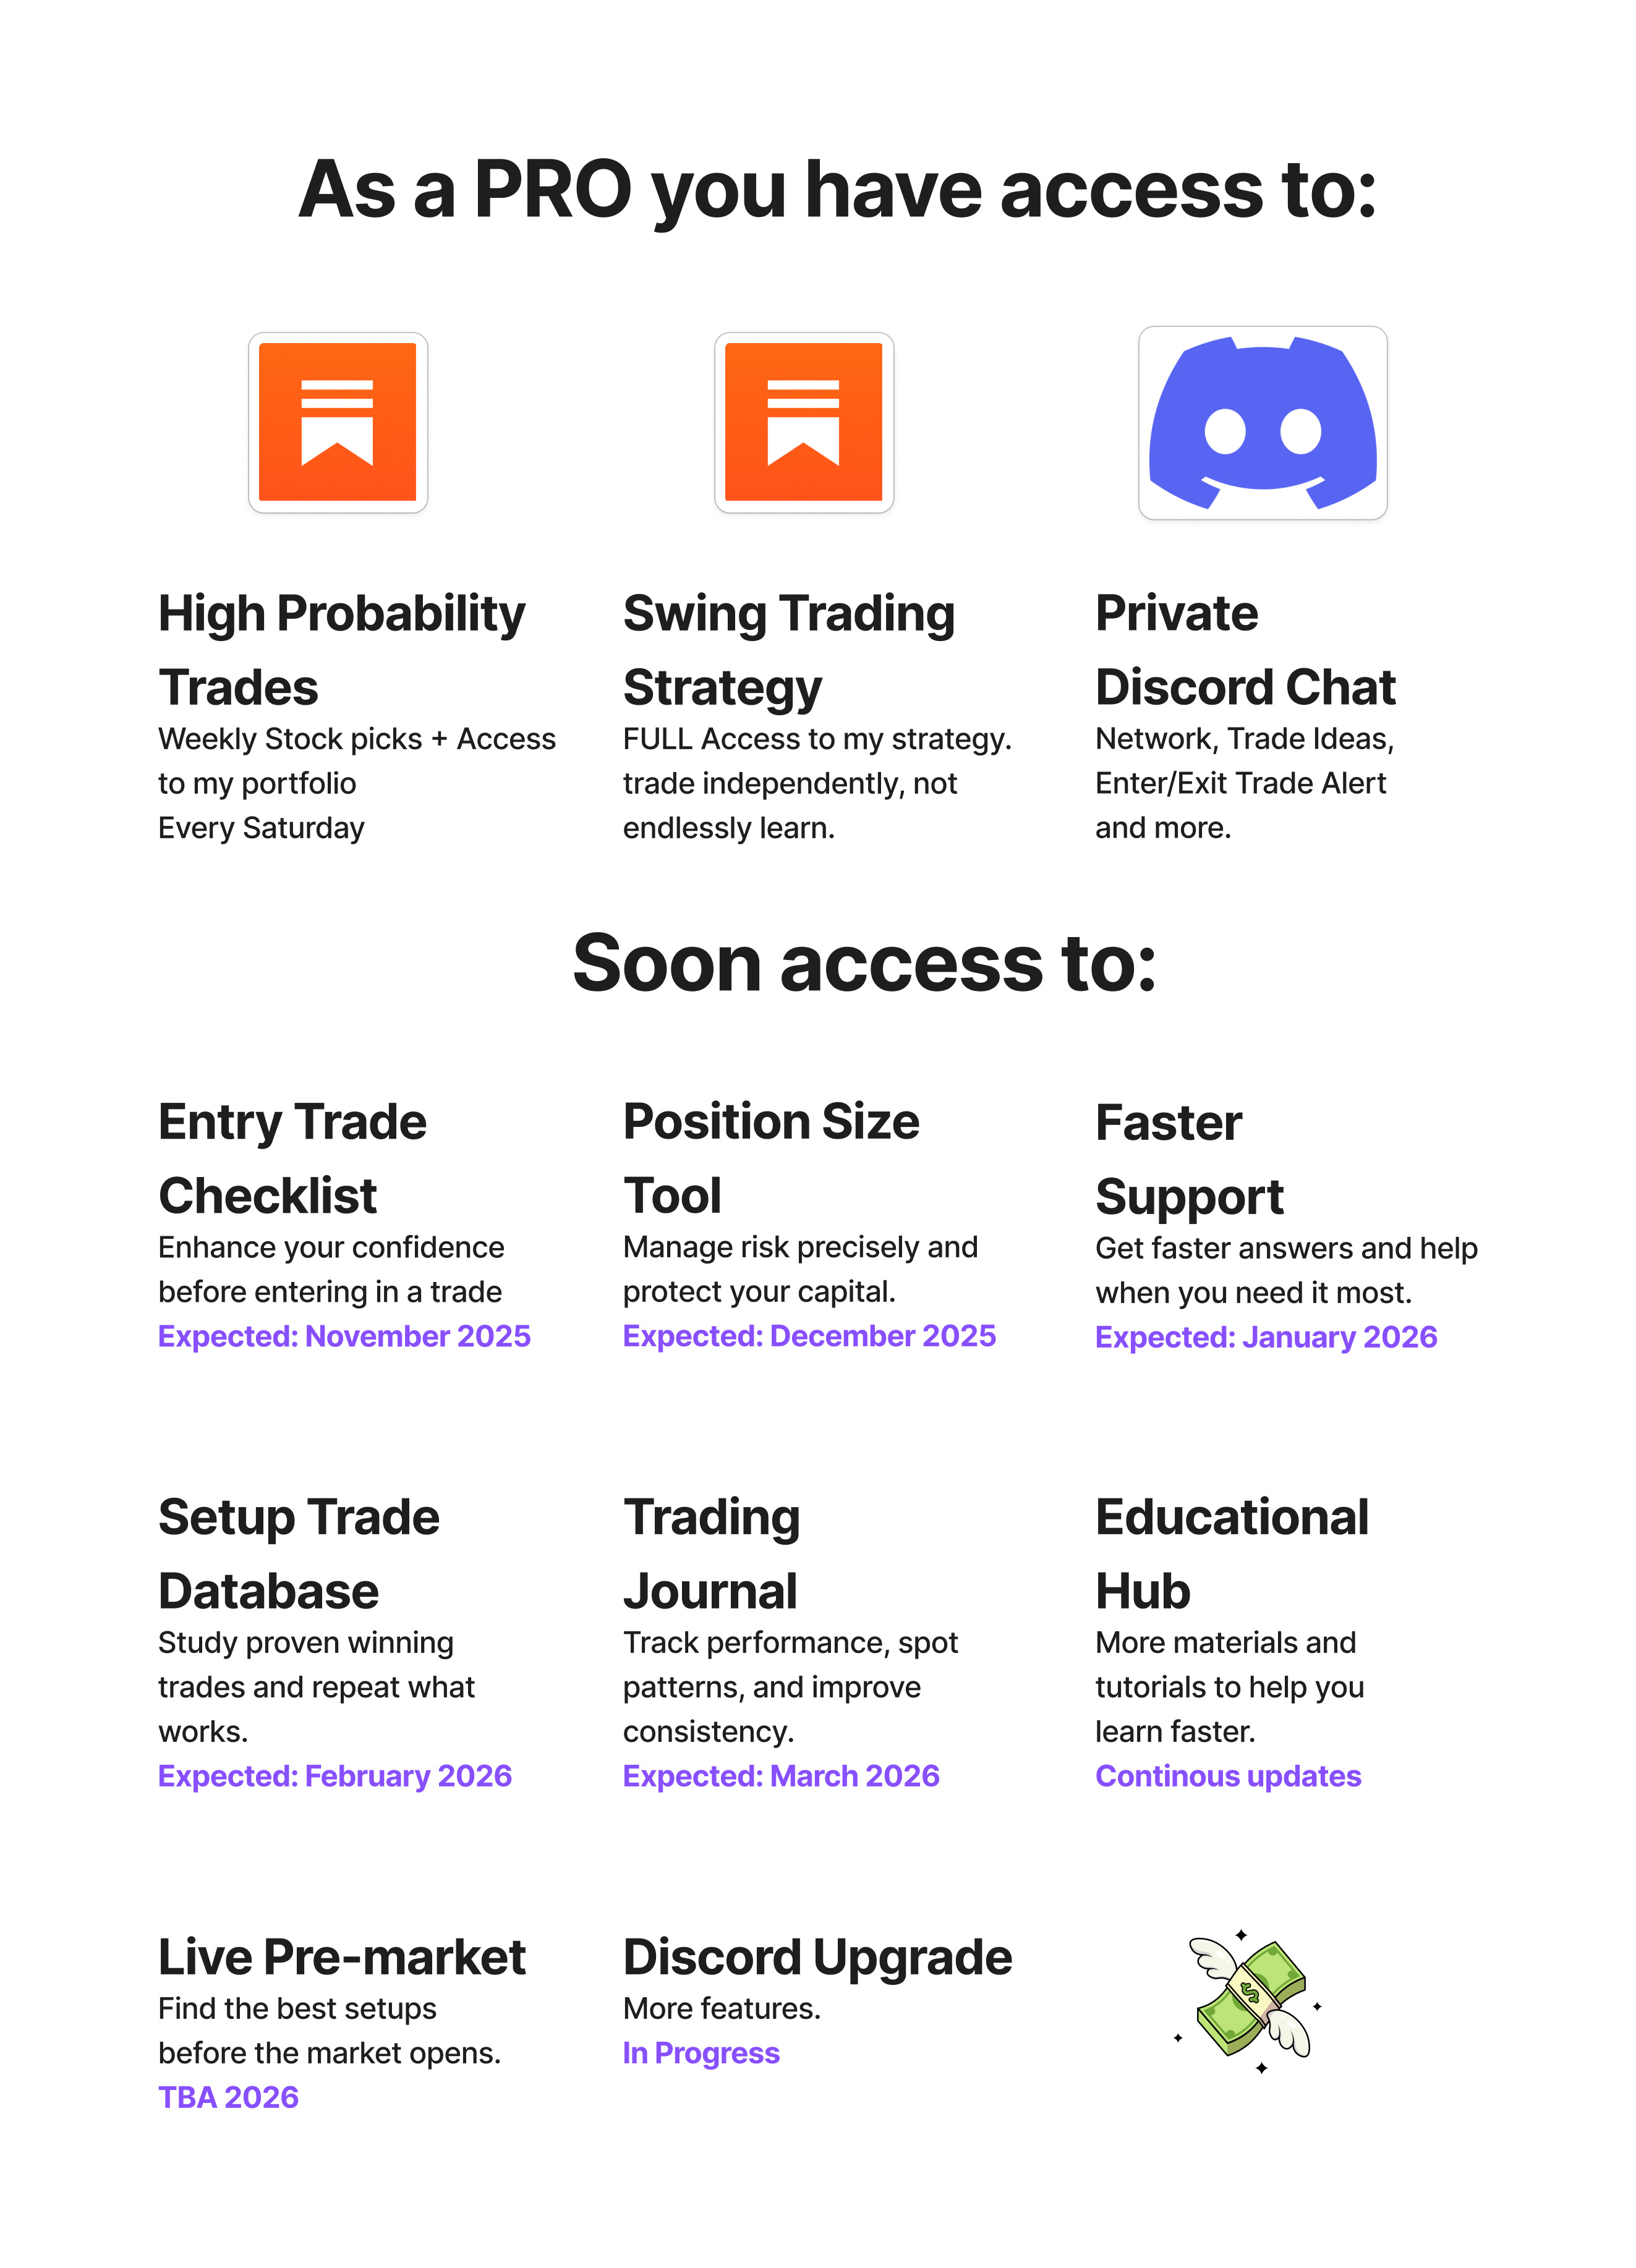
Every dollar earned here is reinvested into building the best trading community possible.
This Week’s Opportunities!
NEW: For every setup I identify, I’ll create a score based on the framework explained in the previous post ..so make sure to read it to understand that metric.
With that being said, here’s what I did:
I closed several positions on Friday, OPEN, ACHR, CRWV, IBKR, MP, and SMR, and trimmed SOUN, realizing a profit of $2,860 after commissions.
All of these names were trading below the 10 EMA, so I decided not to hold them over the weekend.
Risk management comes first!
Right now, I’m only holding AMD, DUOL, RDDT, SOUN, and SOFI.
The goal remains the same: protect capital, ride momentum, and let the data lead the way.
Here is my full watchlist for the week:
https://www.tradingview.com/watchlists/206413877/
PS: I tried to simplify the setup format, as I received feedback from you that it was hard to read.
Ticker: EVLV
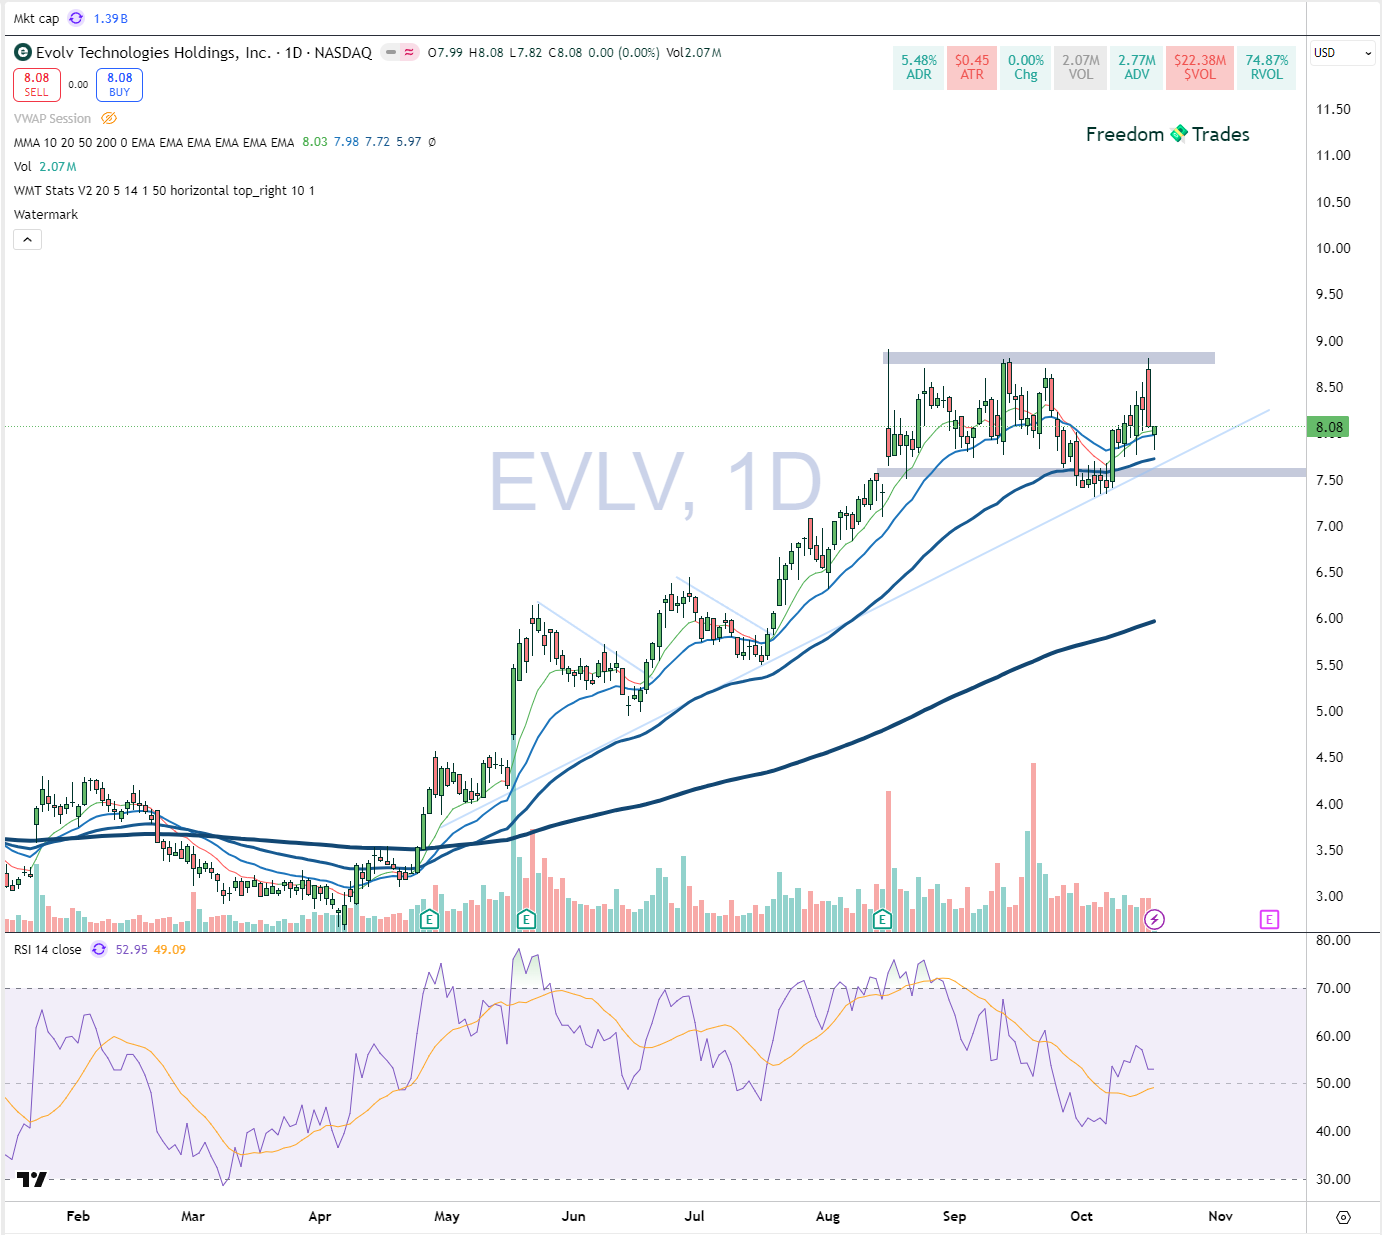
Setup Score: 85 / 100 🟩 A Setup
What I like::
Very clean consolidation base/range forming just under resistance at $9.
Sector: security + AI tech theme still trending in Q4 2025.
Good risk reward if we get a breakout
What I dislike::
No immediate catalyst (earnings, PR, or contract win) visible.
Volume is currently neutral; would like to see raising volume.
If price reclaims and holds above $9.00 with volume ,expect breakout momentum toward $10.50–$11.00 short term.
If price fails to hold above $7.70 (base support), likely retest toward $7 or 200EMA near $6.5, setup invalidates.
Ticker: IONQ
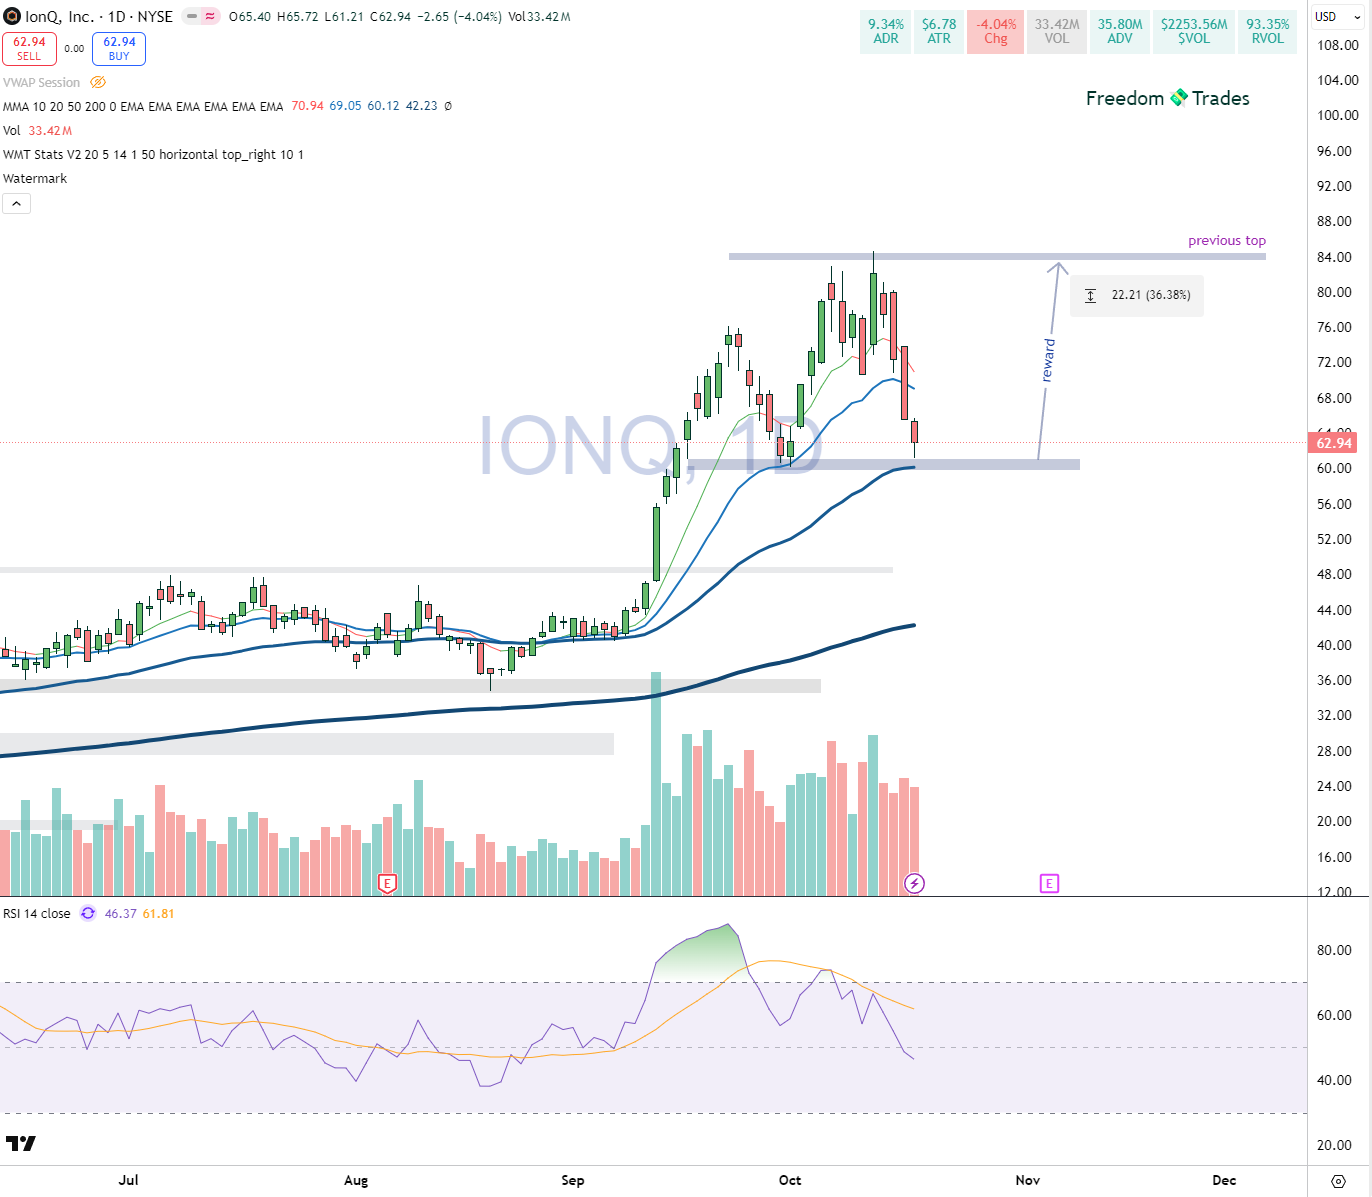
Setup Score: 85 / 100 🟩 A Setup
What I like:
Sector strength: Quantum computing + AI tech space remains among the most speculative and high-momentum areas of the market.
Healthy pullback: Stock retraced to a previous base / 50EMA zone, showing potential for higher-low formation.
Strong liquidity and institutional interest.
Reward potential: ~35–40% to reclaim recent highs around $85 if support holds.
Clear technical structure: You can define risk cleanly at $60 support.
What I dislike:
No near-term catalyst (earnings still ~18 days away).
Failure to hold $60 would invalidate the setup and trigger likely slide toward $52–$54 support.
Currently in pullback mode, so the best play is to wait for confirmation of a bounce off $60 before entering.
Ticker : OUST
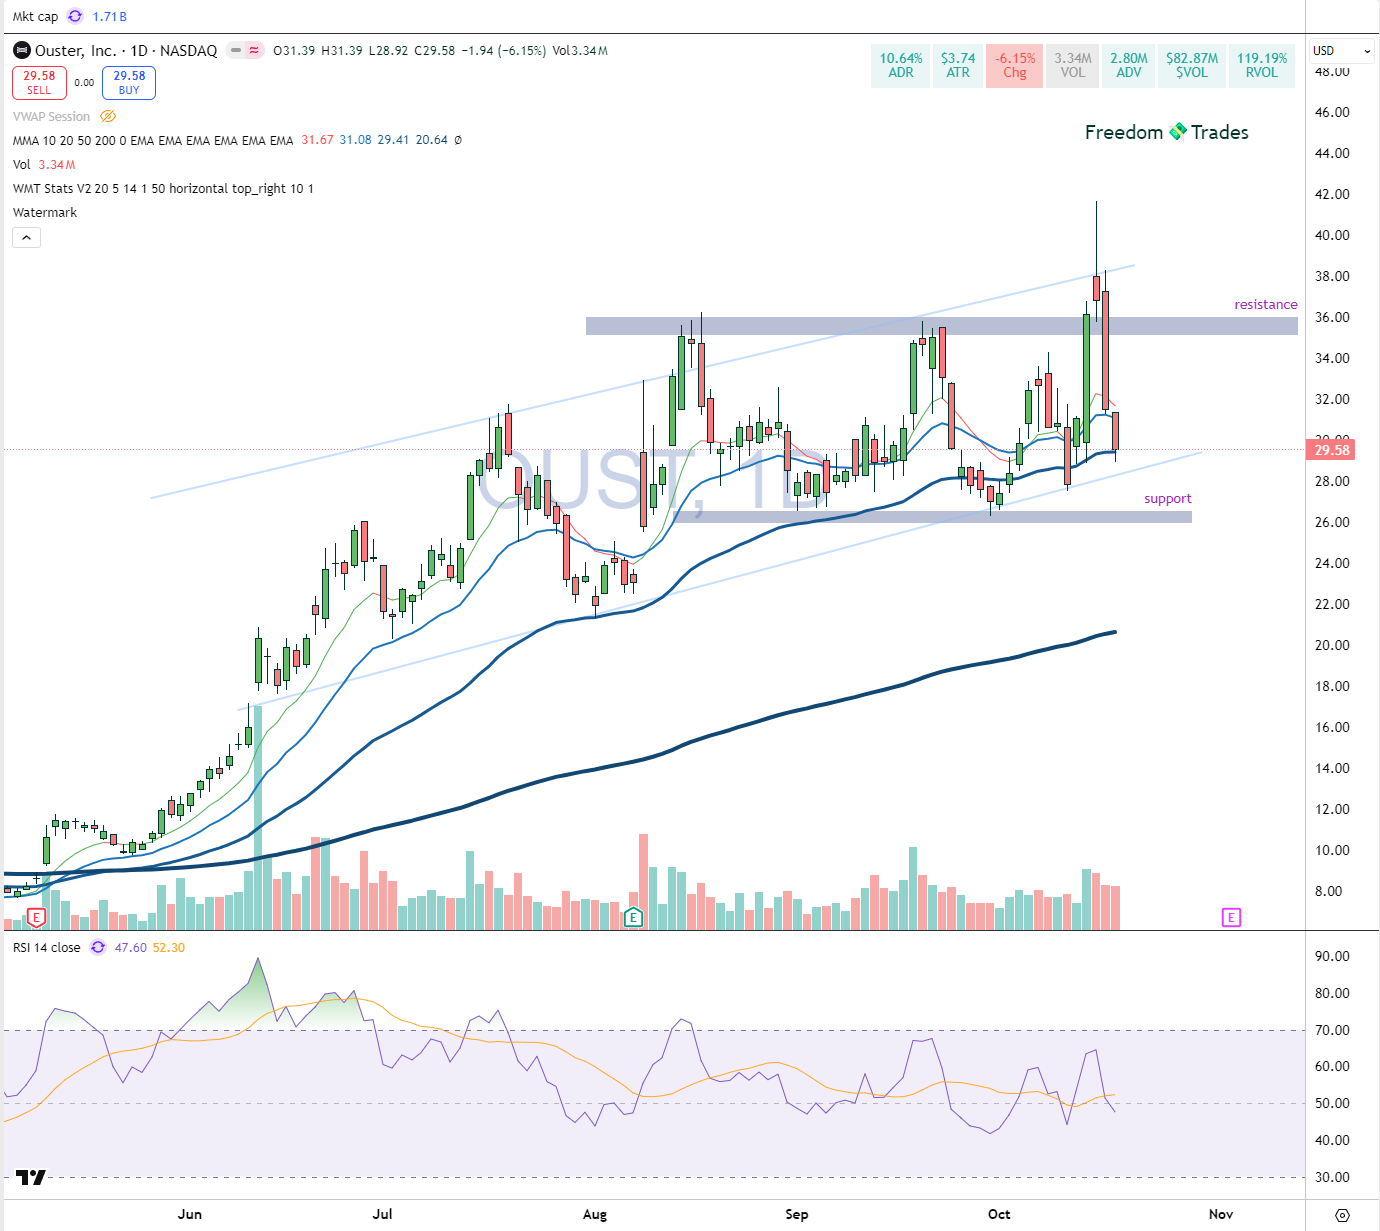
Setup Score: 85 / 100 🟩 A Setup
Positives:
channel formation: price respects the $28–$38 range with consistent reactions.
Currently near support, providing a solid risk-defined entry.
Hot Sector strength
Negatives:
No fresh catalyst momentum purely technical right now.
If price holds $28 trendline and reclaims $31–$32 with volume, expect a bounce toward $36–$38 (top of channel). If it breaks $26.00 support, structure invalidates and could revisit $22–$20 area.
Ticker: RR
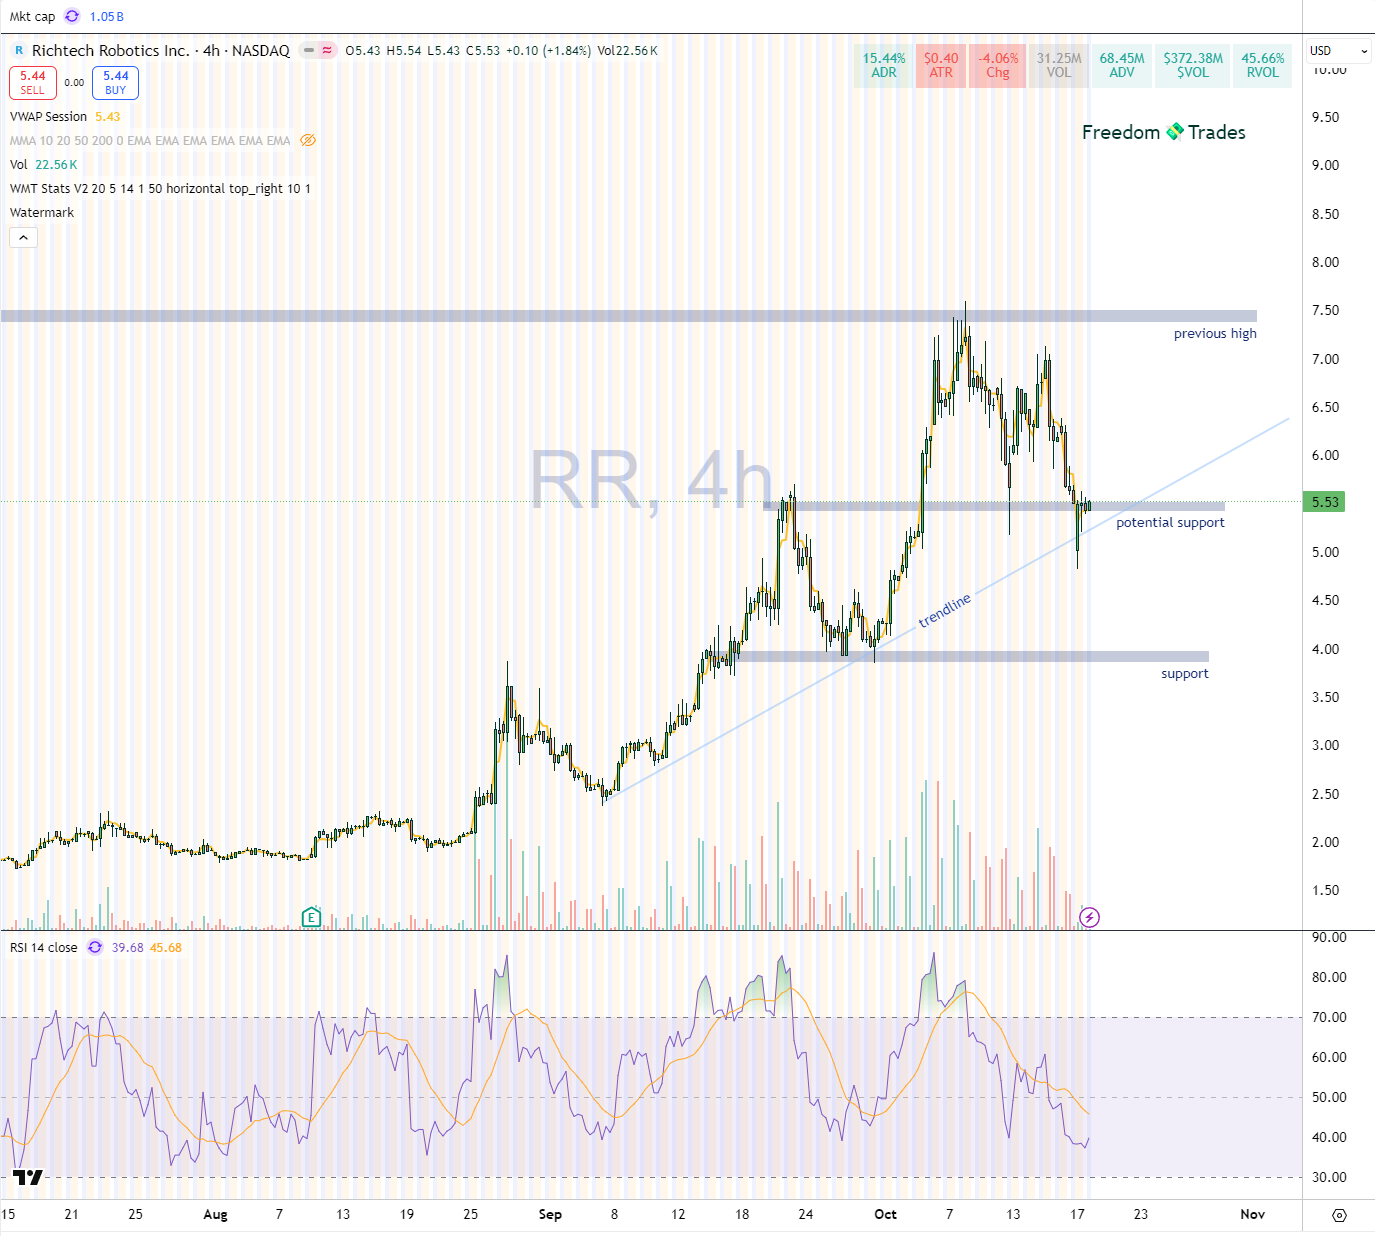
Setup Score : 80 / 100 🟩 A Setup
What I like::
Price is testing a key potential support zone ($5.3–$5.5) with trendline confluence — ideal spot for bounce watch.
Sector strength: AI + robotics continues to attract speculative flows.
Defined risk: a break below $5 invalidates setup cleanly.
What I dislike::
Relative Volume 0.45×, buyers not active yet; could continue drifting before reversal.
needs fresh narrative
If $5.50 support holds and the price reclaims $6.00 with >1.5× relative volume, expect a momentum rebound toward $7.25–$7.50.
If $5.00 fails to hold, likely flush to $4.20–$4.30 (next support zone).
Ticker: QUBT
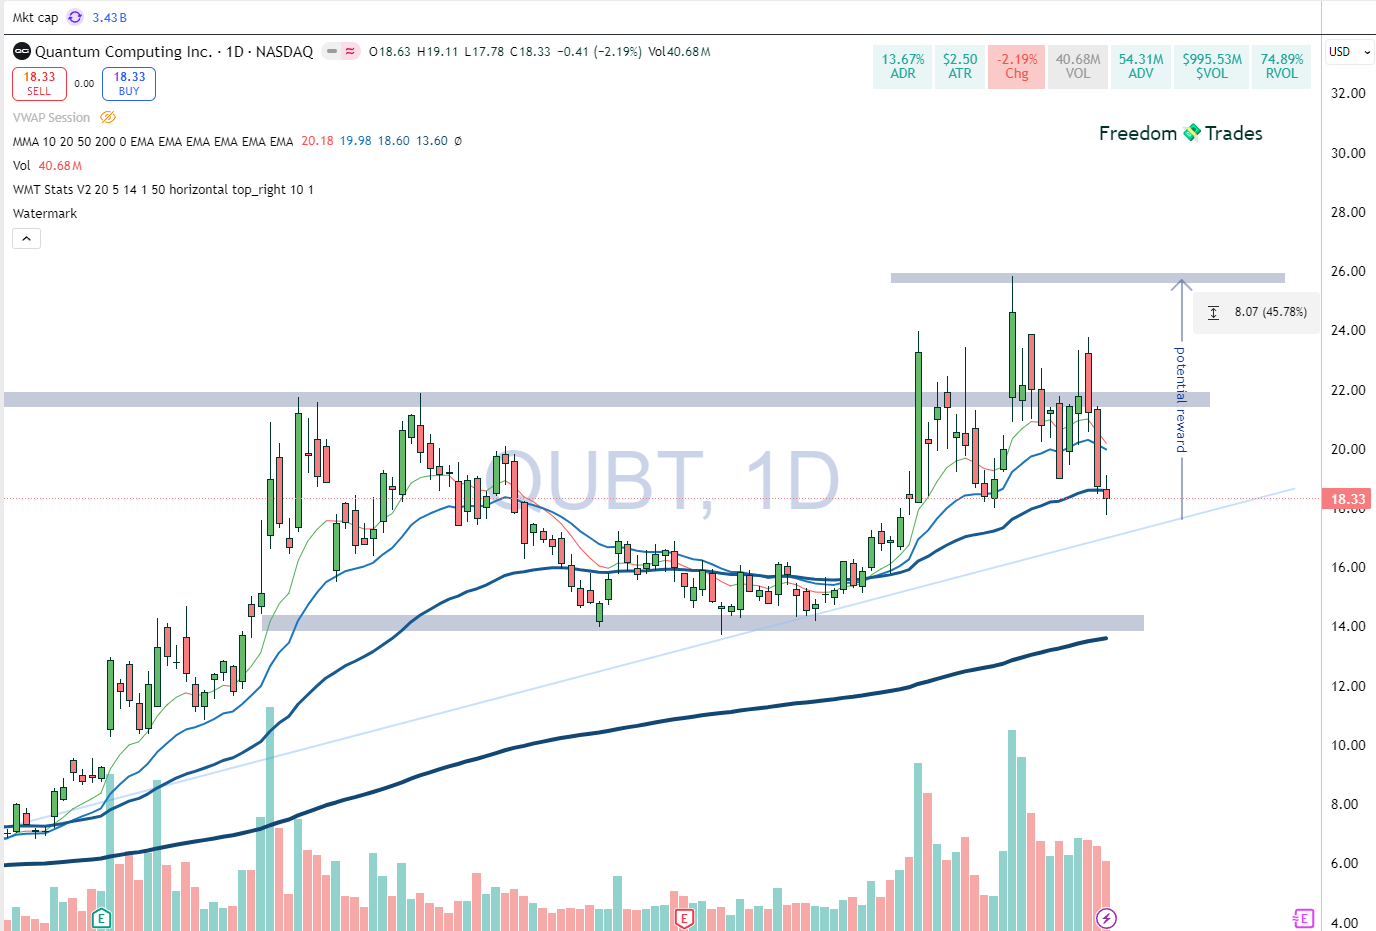
Setup Score: 80 / 100 🟩 A Setup
What I like:
Hot theme (quantum computing + AI) keeps sector momentum favorable.
High potential reward zone: breakout retest to $25–$26 = ~45% upside.
Tight risk level near $17, making it an efficient swing setup.
What I dislike:
No immediate catalyst
Failure to hold $18 could lead to deeper pullback to $16–$14 support.
momentum stock in a hot sector, currently retesting support.
Watch for confirmation above $19 before entry; this could lead to a 45% swing move if the trend resumes.
Ticker : TIGR
Setup Score: 75 / 100 🟨 B Setup
What I like:
Holding near 200EMA, which has acted as a long-term support zone.
Strong prior uptrend and healthy liquidity.
Attractive risk/reward structure if $9 support holds, potential 40% upside to retest $13 area.
Good alignment with overall market strength.
What I dislike:
No strong catalyst
Fintech sector is not hot right now .
Chinese ADR
If price holds above the 200EMA ($9 zone) and volume increases, it could trigger a swing back toward $11–$13 resistance. If it breaks below $9, expect a deeper pullback toward $8 or lower.. setup invalid.
HELP: How to interpret the chart
All charts are daily or weekly timeframe. (check the watermark)
The gray/blue zone marks support and resistance.
The slim blue lines are trend lines
The moving averages used are 200 EMA, 50 EMA, 20 EMA, and 10 EMA.
The 200 EMA is the most important for trend direction.
The 10 EMA is used for exits, if you are in profit and the price closes below the 10 EMA on a daily close, exit the position. (wait for EOD before closing)
Place your stop loss at -10%. For an A++ setup, you can extend it to -15%, but never let a position go beyond that.
Important: That 15% refers to your position size, not your total capital. You should never risk more than 3% of your total capital on any single trade.
I encourage you, if you’re already a PRO member, you can upgrade your membership on the Discord server (at no extra cost) and get access to a fully private server dedicated to PRO members, for networking, trade ideas, insights, and alerts.
Connect PRO account with discord server
P.S.: The email you use on Discord must be the same as the one on Substack.
If you get an error or can’t make it work, message me privately, I might be able to help you out. 🙂
“One trade closer to freedom”
Vladislav
Thank you for sharing!
When I ran the Screener based on the strategy metrics,it gave me a different list. Are some of the stocks on your list from previous weeks still?
Thanks Vlad ! With Quantum stocks in bubble like rise recently, do you think it is still worth risk to go long side for short term?