

High Probability Trades for Week 43, 2025
25 - 31 October 2025 | Edition 14

This post is available exclusively to PRO members and contains my interpretation of the watchlist along with the trading opportunities I see for the next week.
To better understand the strategy we are following and not to buy blindly without any context, please read and analyze my strategy carefully:

All the positions I take can be found in the Freedom Trades private chat and/or Discord Server.
Inside My Portfolio
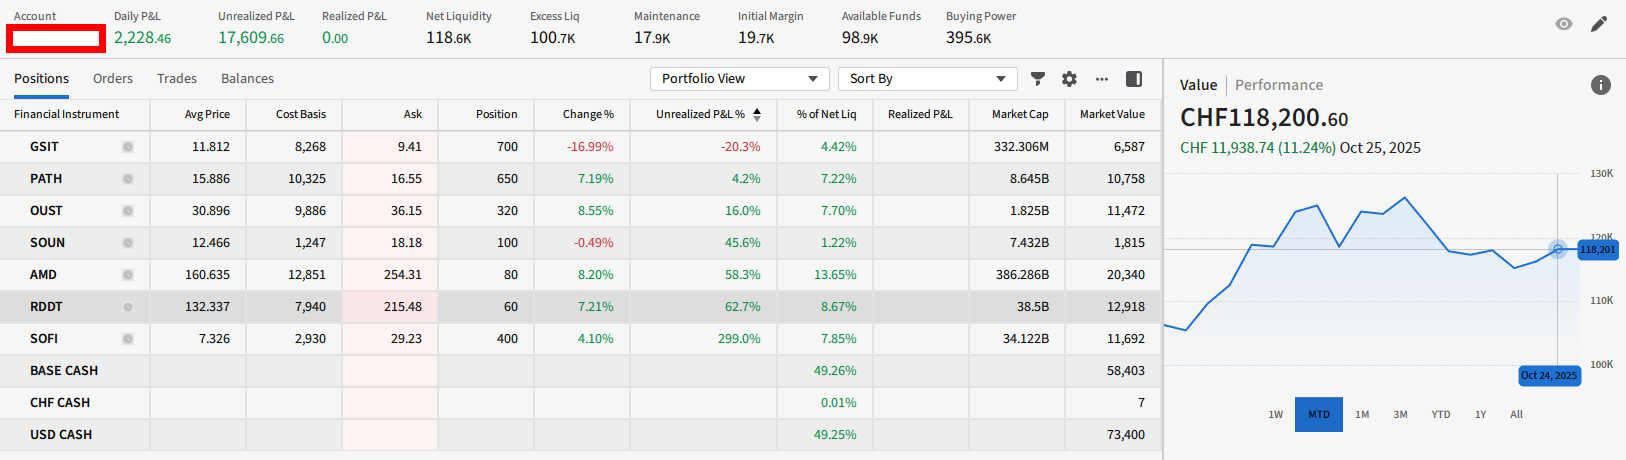
Because you pay for this newsletter monthly, I feel I have the responsibility and duty to be 100% transparent with you. That’s why I’ve introduced this format where I show you every week exactly what my portfolio looks like. (shares, total value of my portfolio, avg price - everything!)
Right now, these are my positions:
Attention: since I live in Switzerland, the currency is set in CHF (which means if you convert it to USD, the amount is higher).
This Week’s Opportunities!
Hey traders, as promised, I’ve created a Momentum Stock Selection Checklist.
Download it or make a copy in Google Docs, and start filtering different setups.
I want you to do this for at least five setups that you identify, so you can get used to the system and practice.
Once you’ve completed this exercise, send me a message.
Here is my full watchlist for the week:
https://www.tradingview.com/watchlists/207244078/
I’ll also be posting different setups on Discord throughout the week. We might have a week full of opportunities, especially if we get some strong earnings reports from the market leaders.
Ticker: RDDT
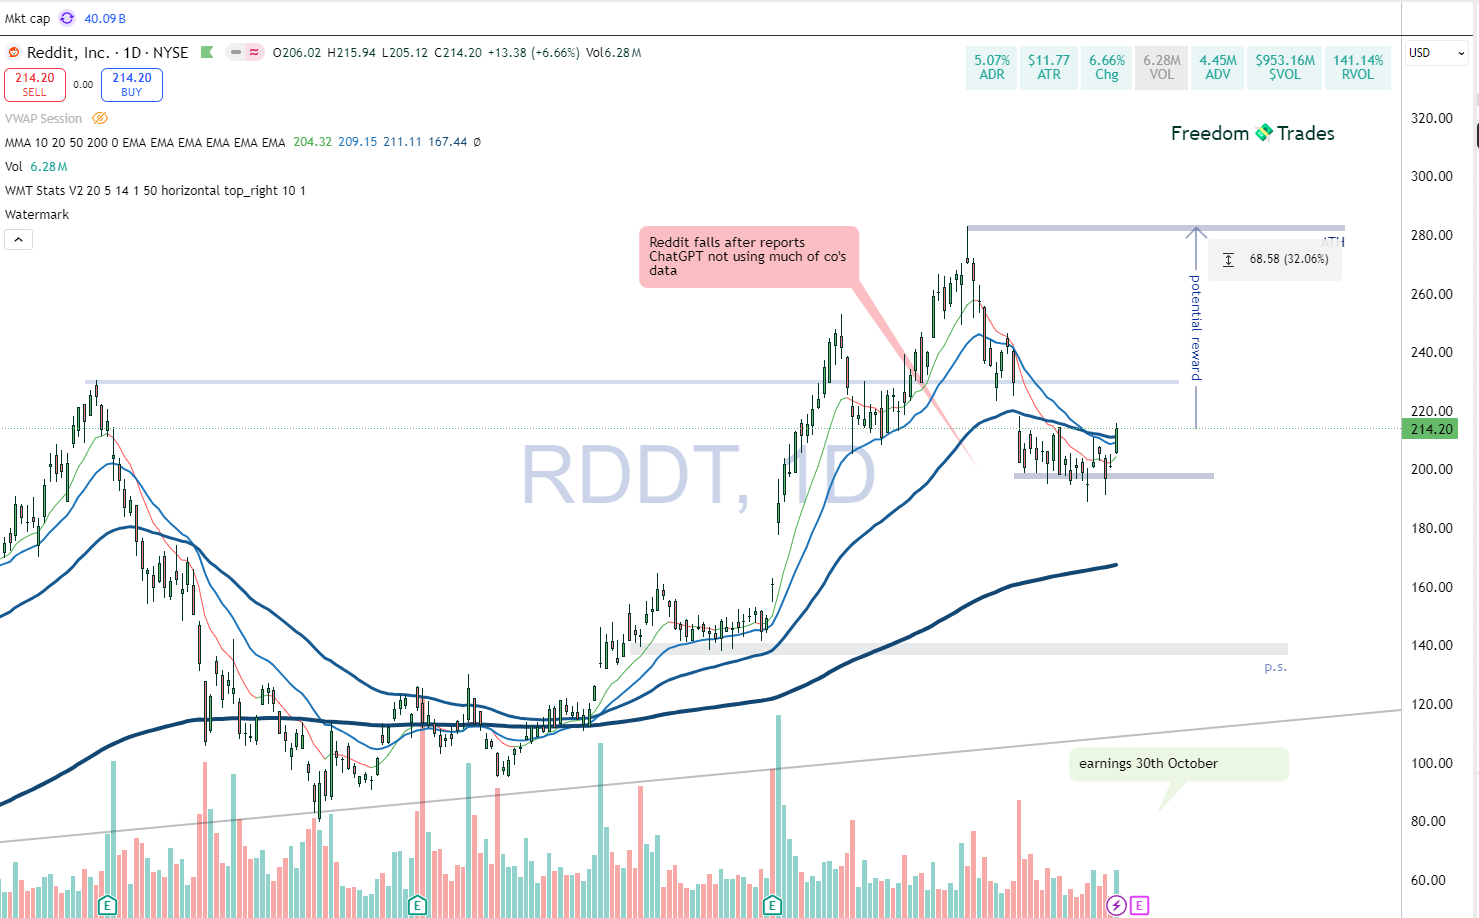
Setup Score: 85 / 100 🟢 A Setup
RDDT is emerging from a multi-week base near $200 with strong volume confirmation. Price has cleared short-term resistance and is aiming for a retest of the $275 area (≈32% potential reward). The risk is defined below $195 support.
Earnings on Oct 30 could act as the trigger catalyst, especially if sentiment shifts bullish on AI/data deals.
Ticker: PATH
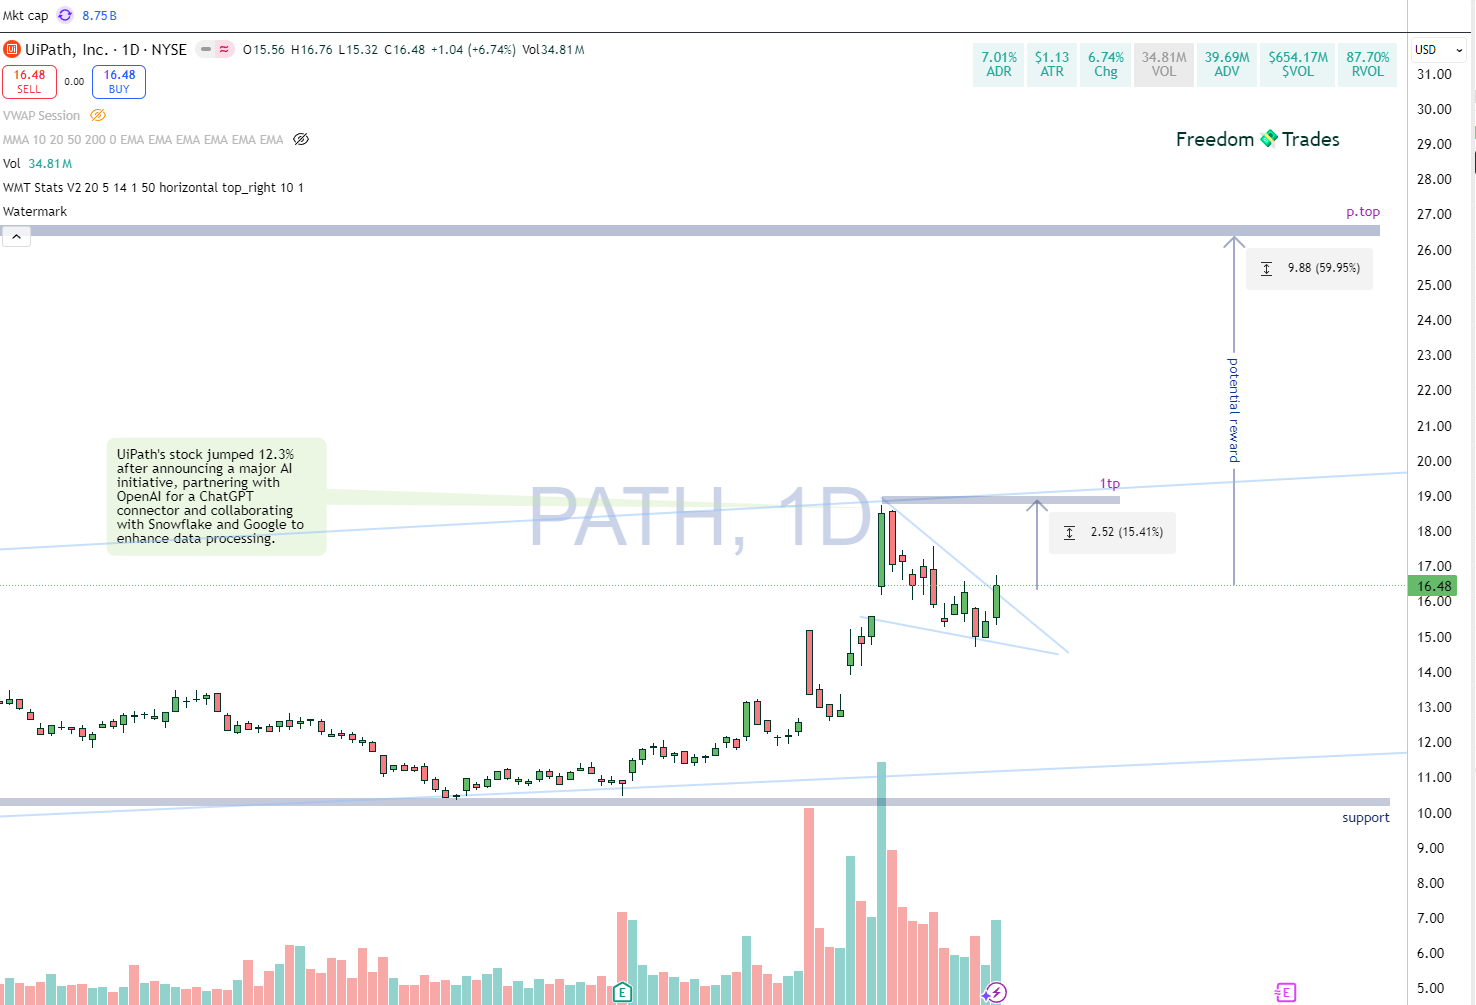
Setup Score: 80 / 100 🟢 A Setup
PATH is coiling inside a bullish flag pattern after a sharp 12% move on AI partnership news.
Volume expansion confirms institutional interest.
Fresh, powerful AI catalyst with big-name collaborations (OpenAI, Snowflake, Google).
High liquidity and strong relative volume.
Technical breakout from a clean continuation pattern.
Market and sector momentum aligned.
Ticker: OPEN
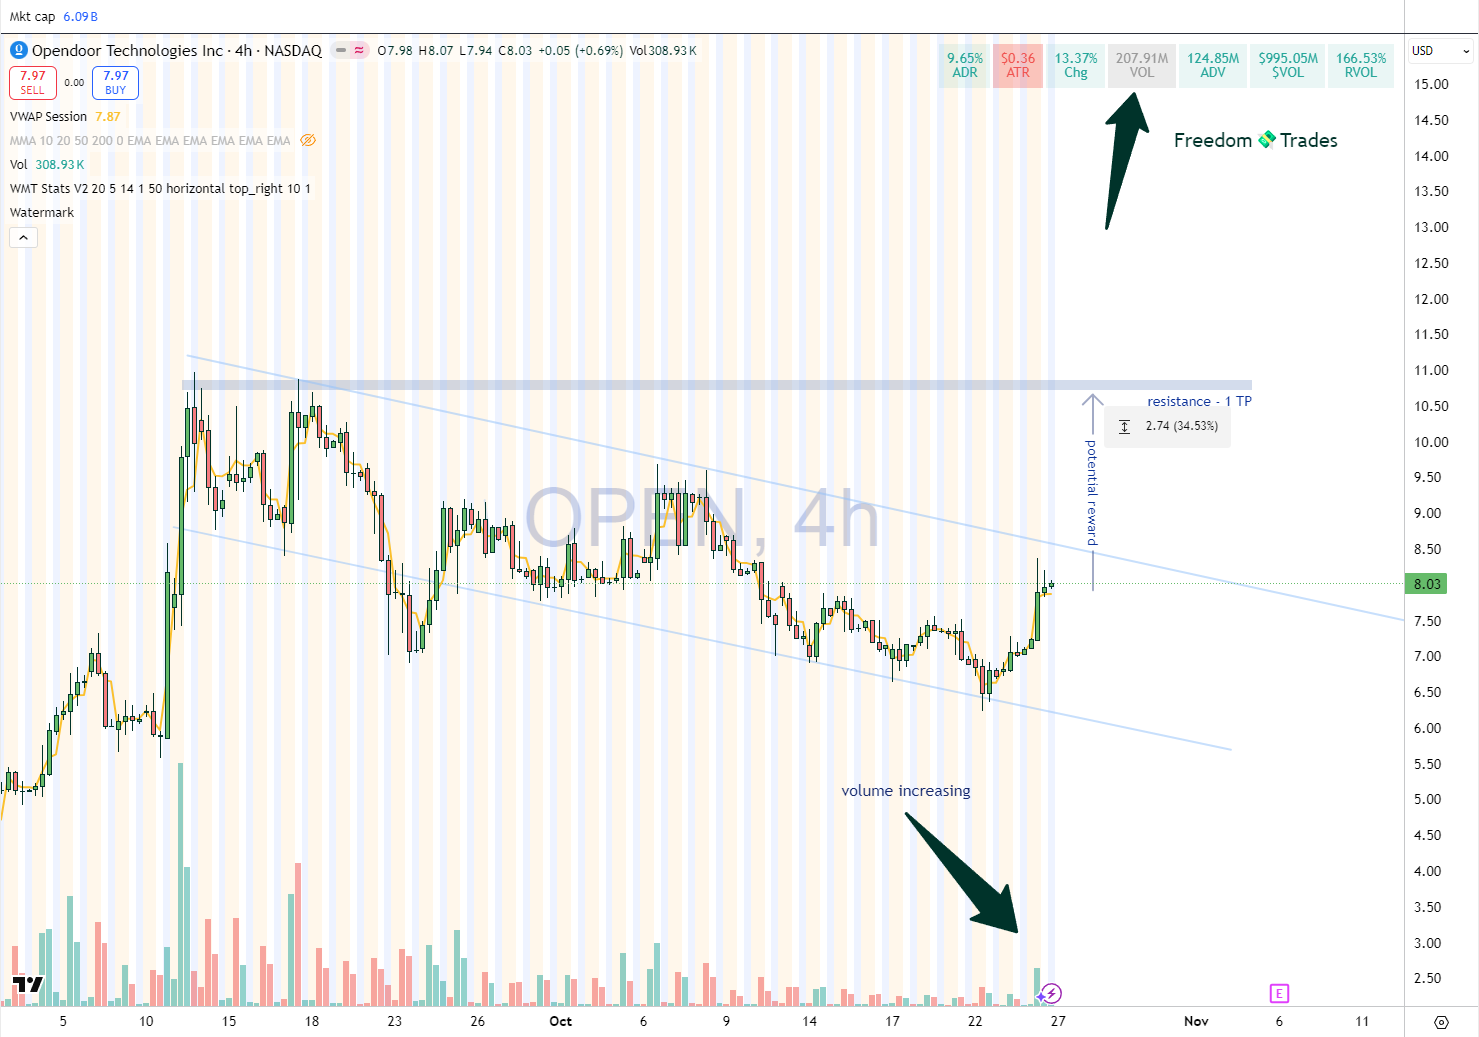
Setup Score: 75 / 100 🟨 B Setup
OPEN is forming a descending wedge breakout on the 4H chart, a bullish reversal pattern.
Volume has been rising steadily, signaling accumulation before breakout.
First target sits around $10.50–$11, aligning with the prior resistance zone and a ~34% upside from current levels.
What I don’t like is:
No obvious fresh fundamental catalyst right now.
Still below key trendline, needs confirmed breakout candle above $8.30–$8.50.
Broader real estate sector remains sensitive to macro (rates, yields).
Not a hot sector rn
Ticker: EVLV
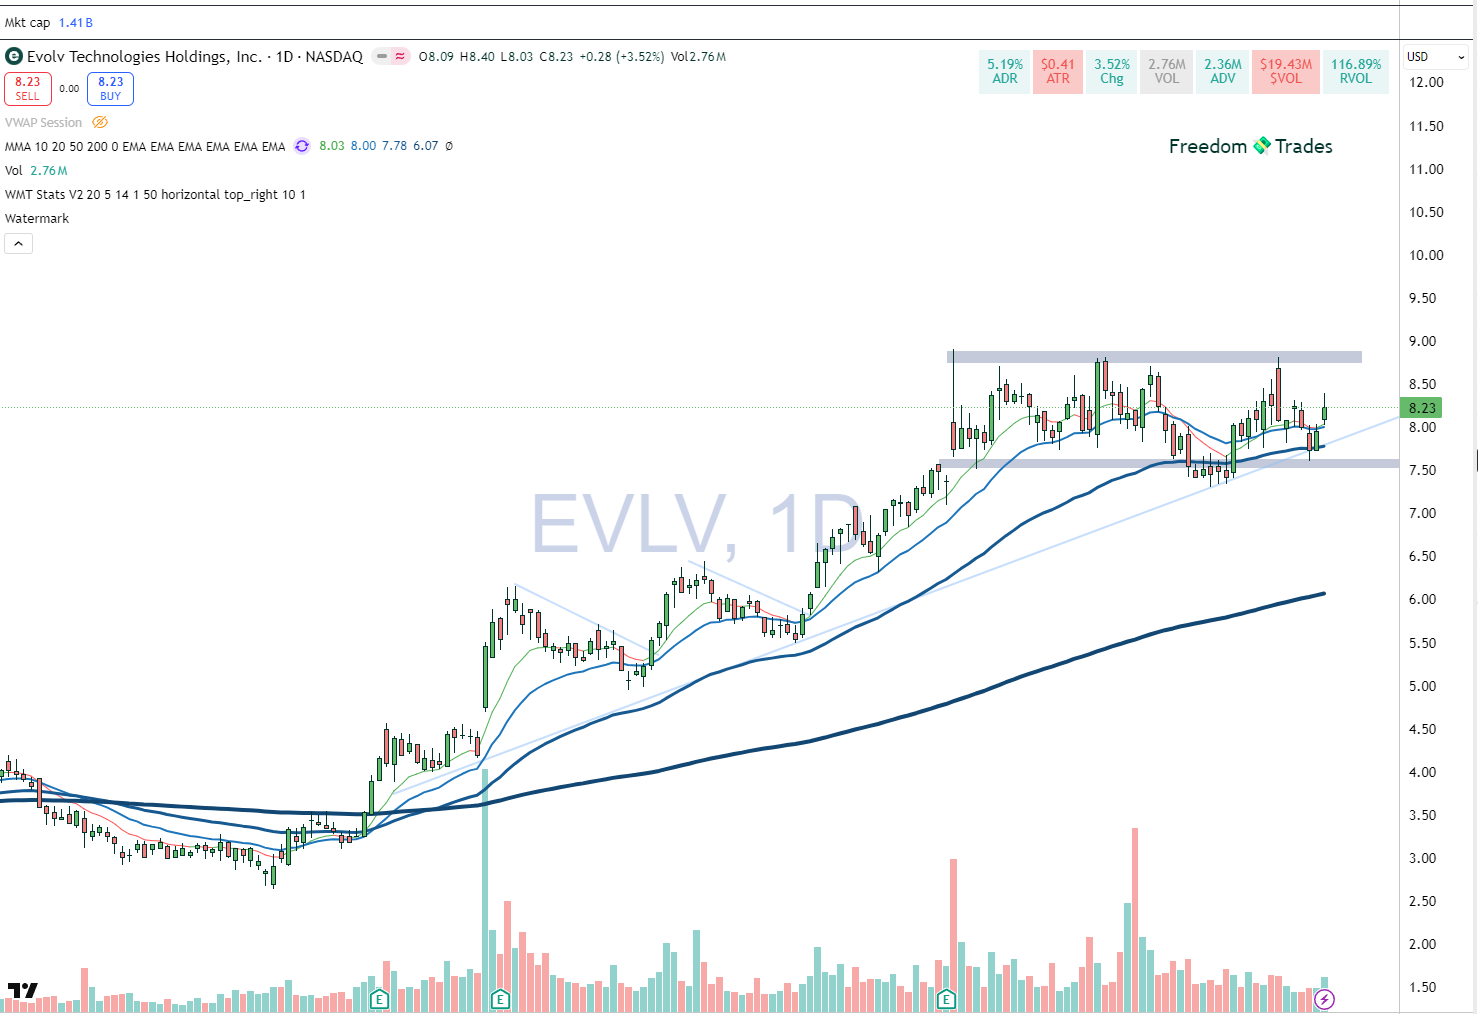
Setup Score: 70 / 100 🟨 B Setup
EVLV is still a valid setup, holding a tight range between $7.50–$8.50 with a rising support trendline.
The base is constructive, but it needs more institutional volume to trigger a clean breakout.
A move through $8.50 with >5M volume would confirm accumulation and likely send the stock toward $9.80–$10.20 (about +18–20%).
Until then, price action suggests controlled accumulation, not an aggressive breakout phase yet.
Ticker: NBIS
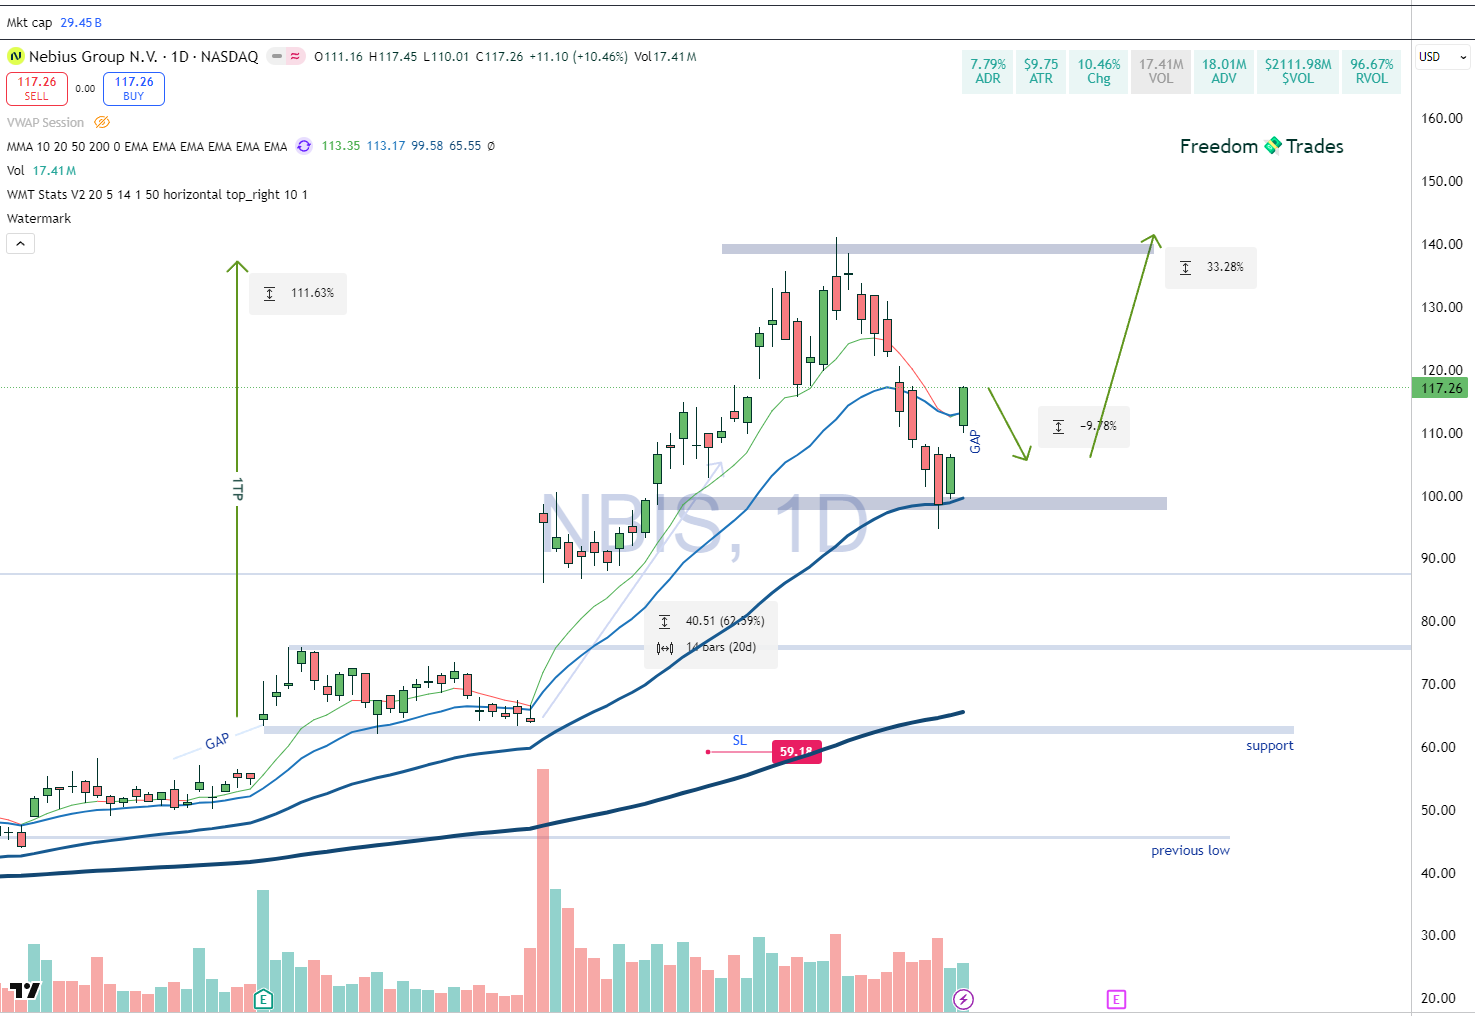
Setup Score: 80 / 100 🟢 A Setup
There’s an incredible amount of forward momentum and volume with this stock.
Right now, the entry price is not great…
Ideally, the stock would retest and fill the gap around the $100 level, allowing us to secure an entry there, after which we could wait for a potential retest of the $140 area, offering roughly a 30% upside potential.
Structure-wise, it’s still in an uptrend, and the pullback looks healthy
Volume picked up slightly at the bottom of the move, suggesting dip buying by institutions.
High-quality, liquid AI/data infrastructure play.
Other interesting tickers for me this week: CRWV, PL and ASTS.
Important links to read and understand:
🟢How to define whether a setup is A+, A, or B. (Click here)
Soon I will add more to this category..
I also plan to simplify this report even further, so you won’t have to scroll endlessly or spend more than 10 minutes understanding it. It should be quick, clear, and easy to digest, especially for those of you with full-time jobs and busy schedules.
Context
Check the chart watermark to identify the analysis timeframe.
The gray/blue zone marks support and resistance.
The slim blue lines are trend lines
The moving averages used are 200 EMA, 50 EMA, 20 EMA, and 10 EMA.
The 200 EMA is the most important for trend direction.
The 10 EMA is used for exits, if you are in profit and the price closes below the 10 EMA on a daily close, exit the position. (wait for EOD before closing)
You are free to choose/decide when to take profits, but the most important is to place your stop loss at -10% (from entry price / avg price if you dont enter with full size).
For an A+ setup, you can extend it to -15%, but never let a position go beyond that.
Important: That 15% refers to your position size, not your total capital. You should never risk more than 3% of your total capital on any single trade.
I encourage you, if you’re already a PRO member, you can upgrade your membership on the Discord server (at no extra cost) and get access to a fully private server dedicated to PRO members, for networking, trade ideas, insights, and alerts.
Connect PRO account with discord server
P.S.: The email you use on Discord must be the same as the one on Substack.
If you get an error or can’t make it work, message me privately, I might be able to help you out. 🙂
“One trade closer to freedom”
Vladislav