

High Probability Trades for Week 45, 2025
10 - 14 November 2025 | Edition 16

This post is available exclusively to PRO members and contains my interpretation of the watchlist along with the trading opportunities I see for the next week.
To better understand the strategy we are following and not to buy blindly without any context, please read and analyze my strategy carefully:

All the positions I take can be found in the Freedom Trades private chat and/or Discord Server.
Inside My Portfolio
Because you pay for this newsletter monthly, I feel I have the responsibility and duty to be 100% transparent with you. That’s why I’ve introduced this format where I show you every week exactly what my portfolio looks like. (shares, total value of my portfolio, avg price - everything!)
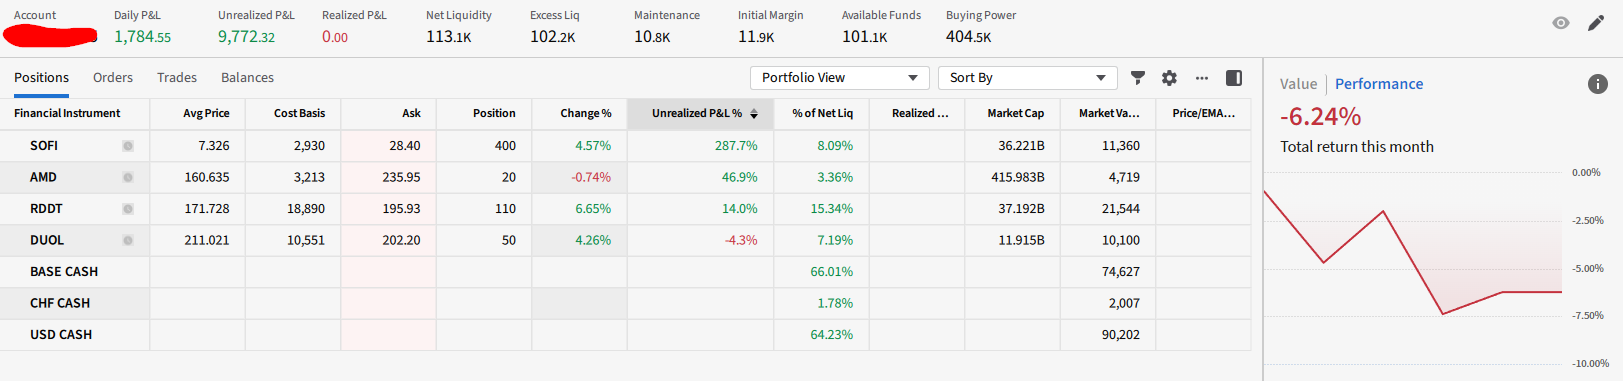
Right now, these are my positions:
Attention: since I live in Switzerland, the currency is set in CHF (which means if you convert it to USD, the amount is higher).
You can copy my watchlist here: https://www.tradingview.com/watchlists/208912656/
This Week’s Opportunities!
Dear traders,
As you know, since the end of October I’ve been in a drawdown of around 9.8% from my account’s all-time high. This past week has been tough for most traders, and for me it meant a -6% hit to my total portfolio.
Here are the measures I’ve taken:
- Sold all positions that went beyond -9% unrealized loss
- Trimmed and sold some winning positions (like SOUN and AMD)
- Moved mostly to cash
- Reduced my position sizes
- Tightened stop losses (risking less than 1% of my portfolio per new position)
- Staying patient until clear setups return
What I could have done better was to start hedging my portfolio earlier, ideally by selling MES futures after Tuesday’s session.
Now, I want to talk a bit about the current state of the market.
Everyone’s screaming “bubble, bubble, it’s all going to pop, the market’s insanely inflated.”
Let me paint a contrarian picture, because I don’t agree that we’re in a bubble. In fact, I believe there’s still plenty of room to grow before we can truly call it one. Right now, the market is performing average at best.
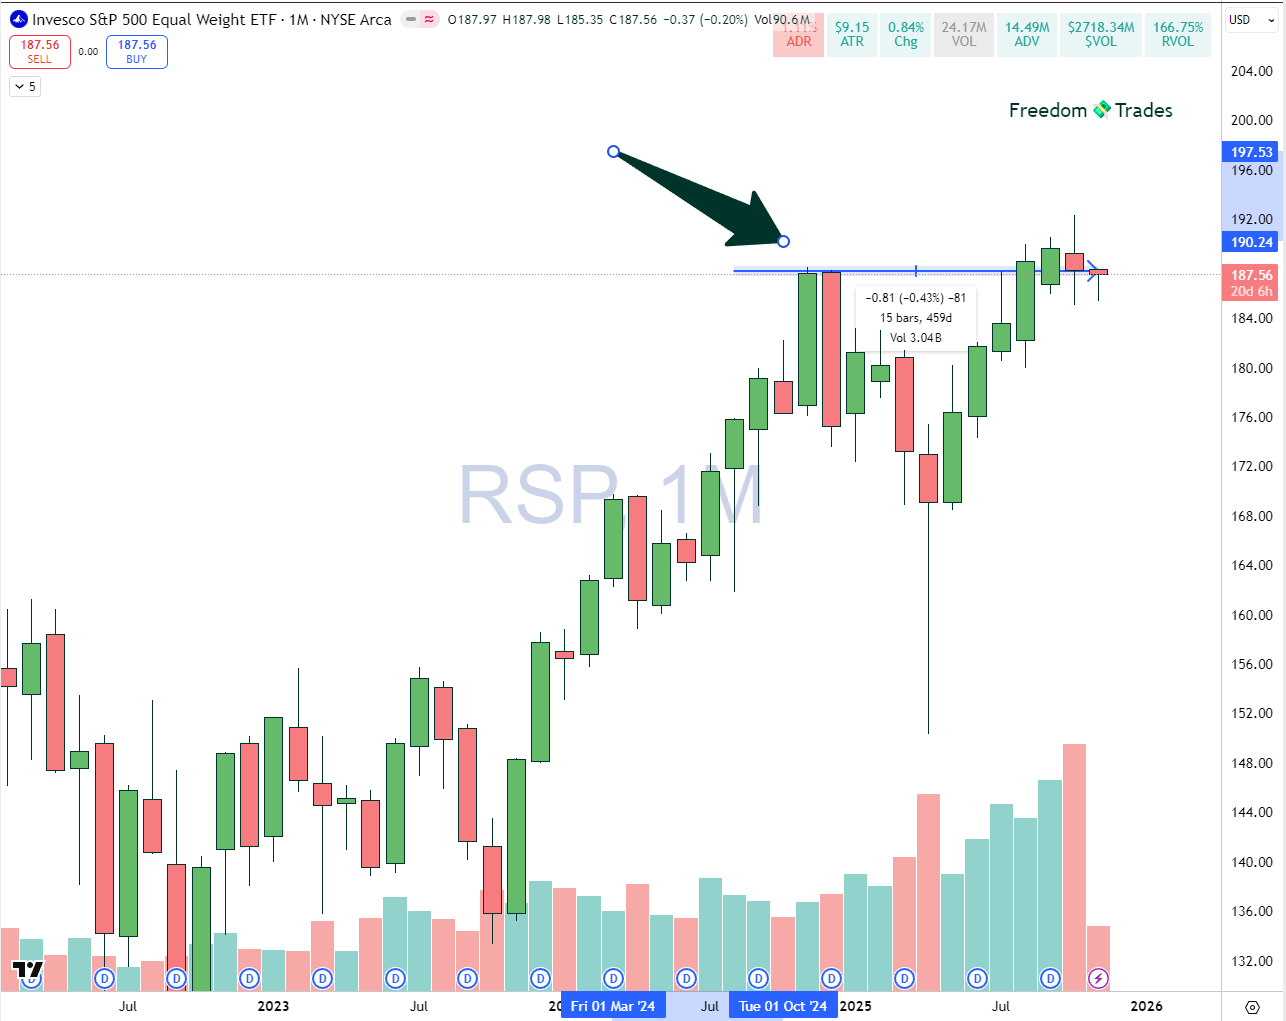
If we look at the equal-weighted S&P 500, it’s still 0.4% below its 2024 all-time highs …hardly bubble territory.
It might feel like a raging bull market, but under the surface, it’s mostly an AI mega-cap story.
Even the equal-weighted QQQ is only about 3% above its 2024 highs.
In a true bubble, you see massive participation across all sectors.
Back in 2021, literally every penny stock was ripping above $1. There were even retail “challenges” where people were buying penny stocks just to push them past the $1 mark.
What I’m trying to say is that the level of euphoria is still far…
We’d need much broader market participation for that kind of environment to return.
That being said, I see a lot of traders saying they’ll skip trading next week, and honestly, that’s probably the smart move.
Looking at the overall market, especially ES (S&P 500 futures), Friday closed strong after printing a fresh low around $6,656.
Normally, that kind of candle is perceived as bullish, but this time, context matters more than the candle itself.
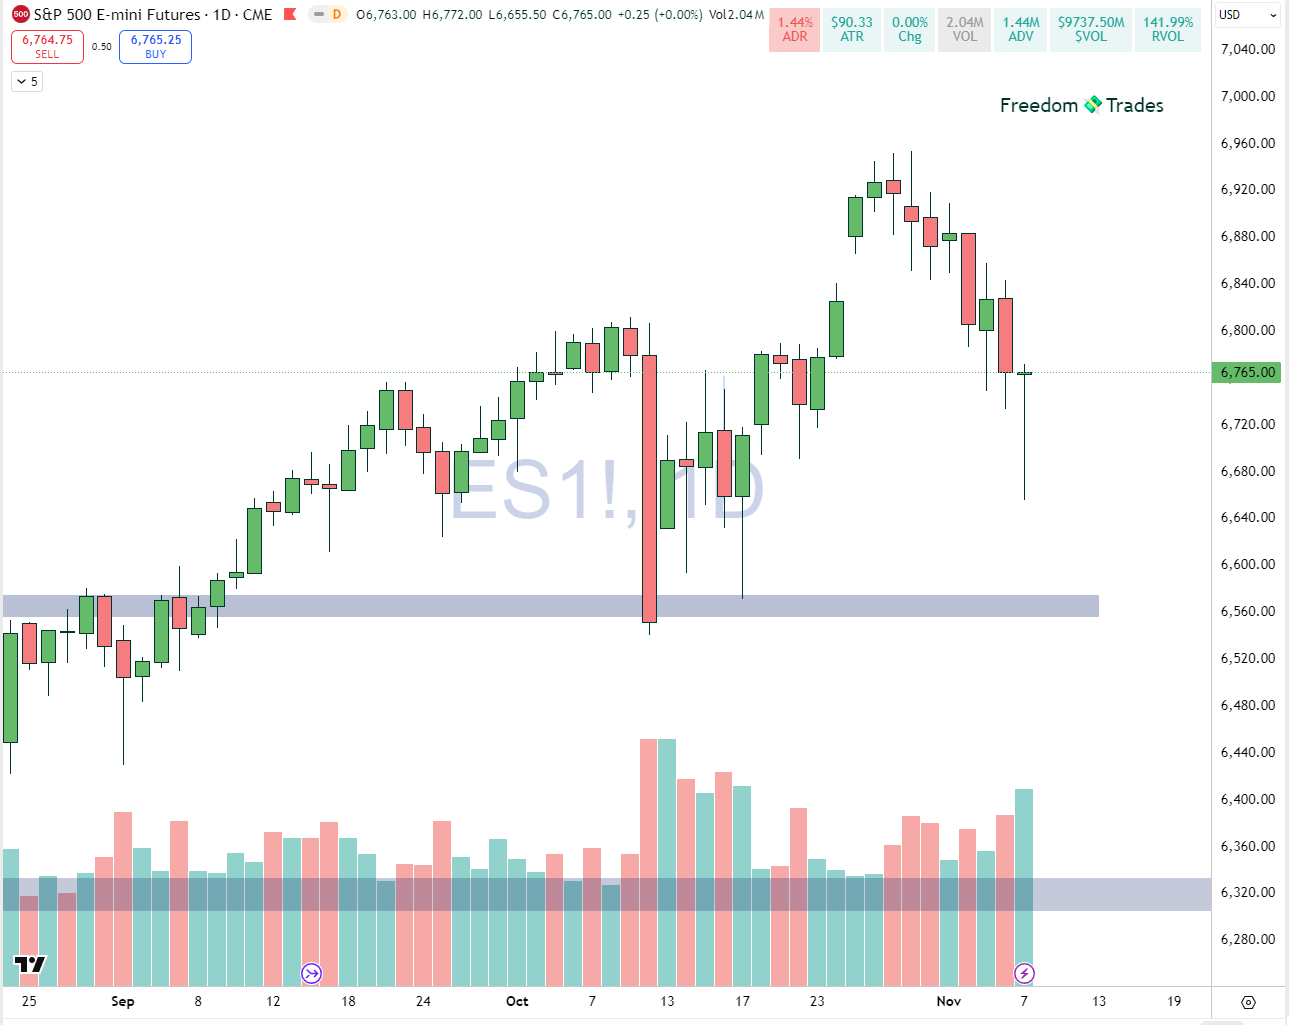
Volume was high, but the rebound came right in the middle of a broader selloff , more likely short covering than real accumulation. The structure still looks weak: lower highs, lower lows…
Unless we see strong follow-through above 6880–6900 with solid volume, Friday’s bounce could easily turn into a classic bull trap before another push toward the 6550–6600 support zone.
In times like this, staying flat is often the most profitable position. It could also trade in ranges for few weeks.
That being said, I see a lot of interesting charts with potential setups … but given the current market environment, I’ll only mention the safest ones, which in my view are META and NFLX.
Other interesting charts are: RDDT, LAES, APLD, DUOL, and Quantum & Minerals sector.
Ticker: NFLX 0.00%↑
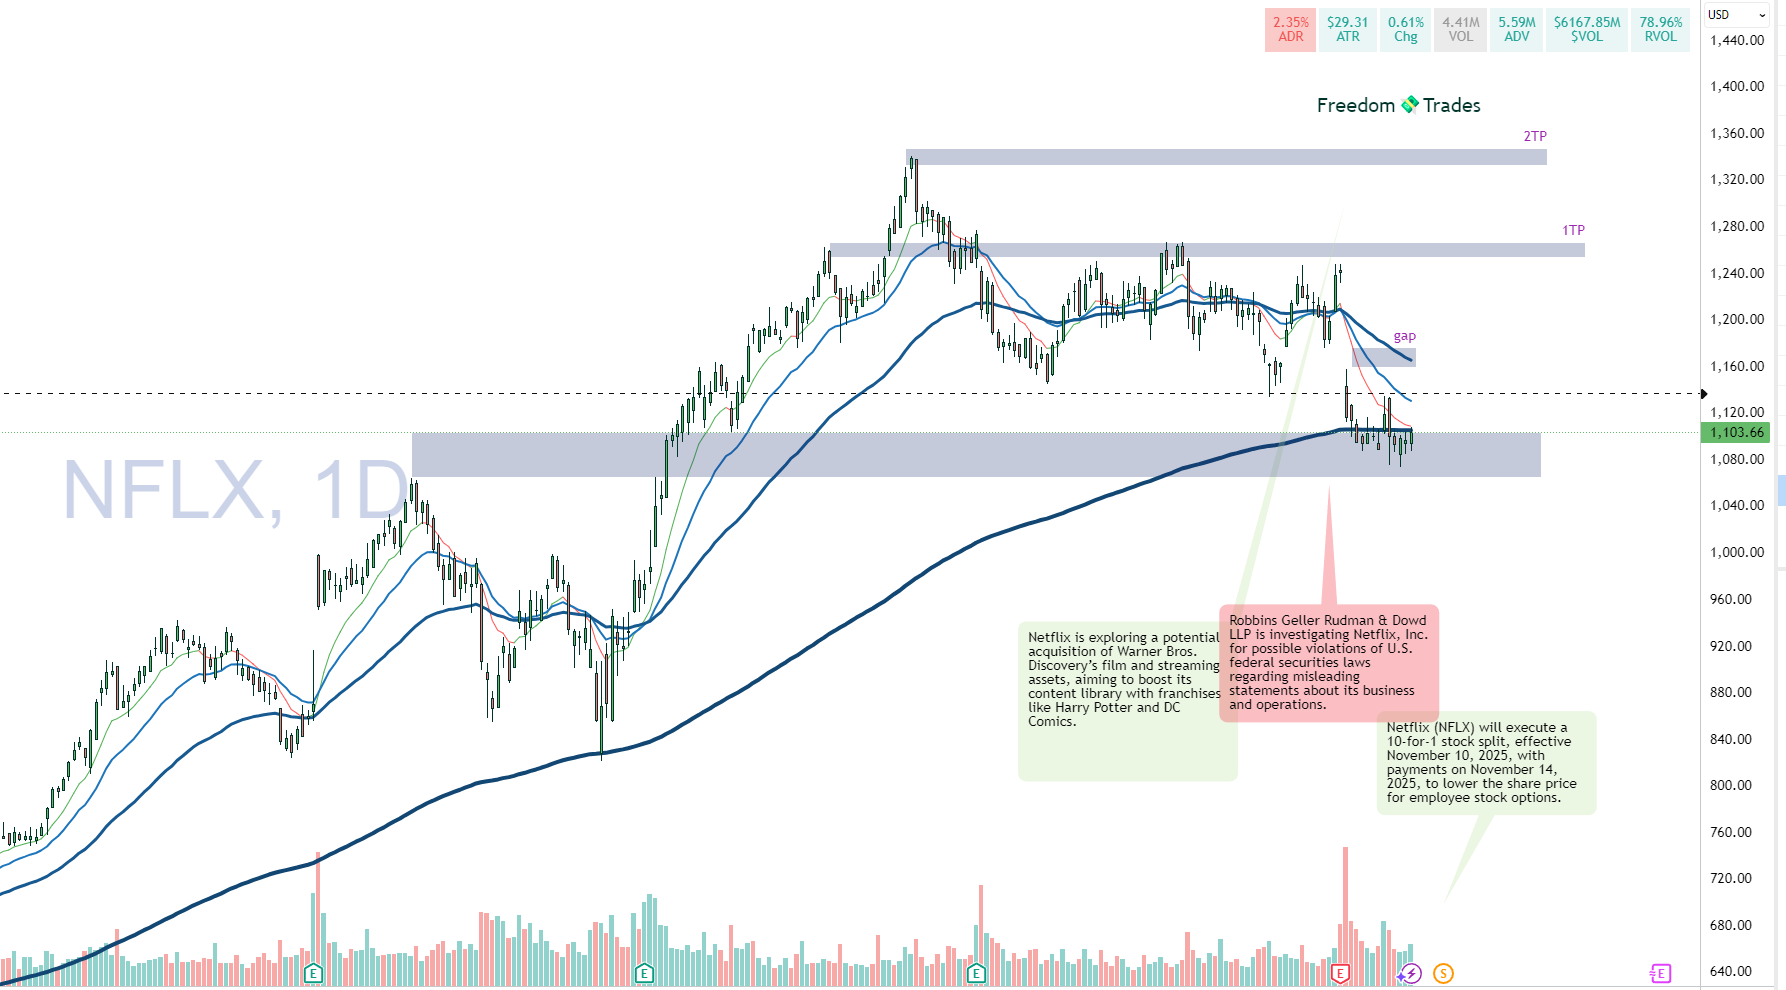
Setup Score: 90 / 100 🟢 AA+ Setup
If we look at the most recent times when Netflix dropped below or touched the 200 EMA, we can see that it didn’t stay there for long. This was the case in April 2025, August 2024, and even October 2023.
Now, if the market helps us and the general direction remains positive, we could see a quick recovery toward the first take profit (TP), offering a potential reward of around 12% for TP1 and approximately 20% for TP2.
However, the issue is that the ADR (Average Daily Range) is currently around 2%, which makes it a slow mover. We don’t want to keep money parked in something that, on average, only moves 2% per day. To reach that 20% target, we might need to stay in this trade for quite a while, possibly 2-5 months.
One way to accelerate that ADR would be to look at the NFLU ticker, which represents Netflix 2X Long. Essentially, it moves twice as much as Netflix, which can amplify your gains … but be careful, because it also amplifies your losses.
If Netflix loses 50% of its value, you would effectively be liquidated, since this is a leveraged product. So make sure you size your position carefully!
Also, for those trading options, this setup can definitely be used to your advantage.
Ticker: META 0.00%↑
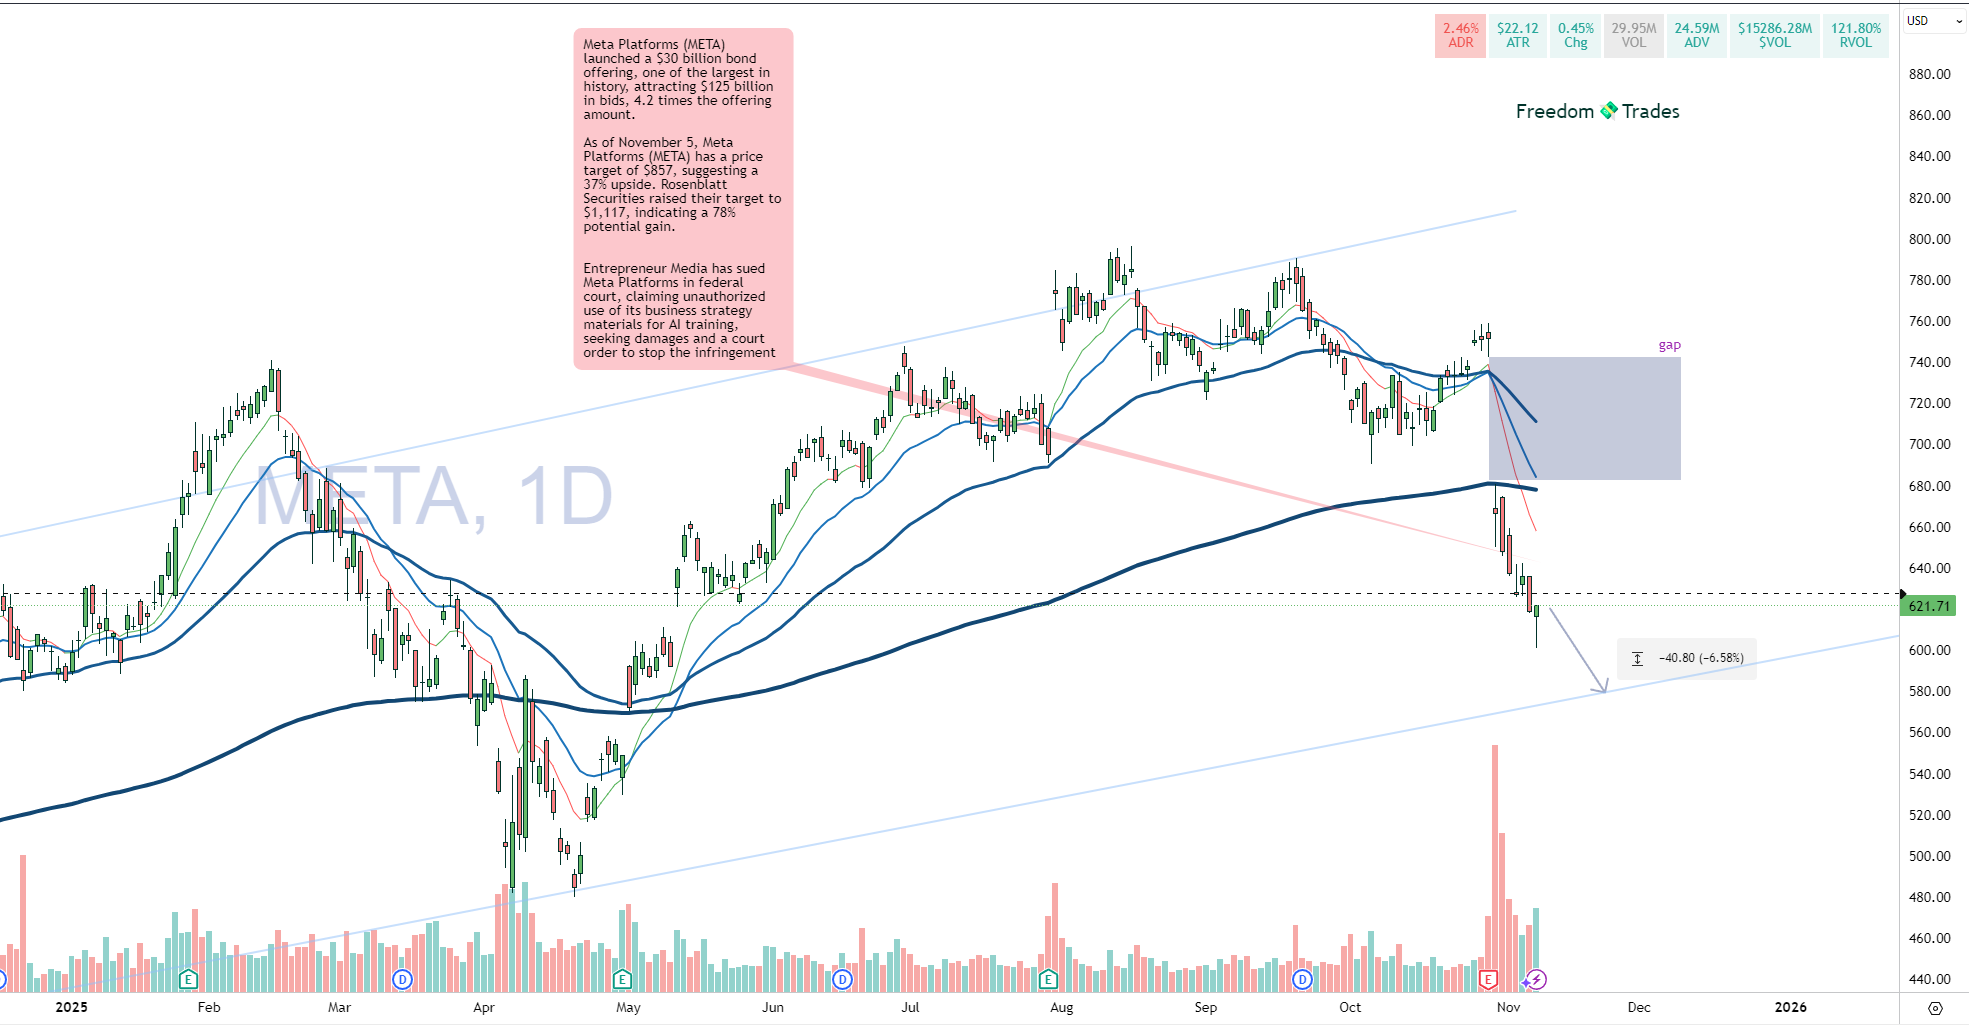
A strong close on Friday doesn’t necessarily mean it’s a buy signal , it could just be a bull trap. I still haven’t seen that accumulation zone where price starts to tighten and volatility begins to drop.
I want to mention this ticker because it’s important to keep an eye on it…it’s one of the MAG 7. Any pullback here represents a rare opportunity to enter one of the “safest” tickers out there.
That gap needs to be filled, and we know from statistics that around 60% of gaps eventually get filled (on mega large-cap stocks like this one.)
One way or another, it will be filled, the only problem is, we don’t know when.
The way I’d play META is by waiting for it to form a consolidation base and seeing if it starts making higher lows and reclaims the 200 EMA line, that’s where I’d start buying.
It could turn into a great opportunity, especially for those using leverage, such as options traders or single-stock leveraged ETFs, to boost that ADR%.
Important links to read and understand:
🟢How to define whether a setup is A+, A, or B. (Click here)
Soon I will add more to this category..
Context
Check the chart watermark to identify the analysis timeframe.
The gray/blue zone marks support and resistance.
The slim blue lines are trend lines
The moving averages used are 200 EMA, 50 EMA, 20 EMA, and 10 EMA.
The 200 EMA is the most important for trend direction.
The 10 EMA is used for exits, if you are in profit and the price closes below the 10 EMA on a daily close, exit the position. (wait for EOD before closing)
You are free to choose/decide when to take profits, but the most important is to place your stop loss at -10% (from entry price / avg price if you dont enter with full size).
For an A+ setup, you can extend it to -15%, but never let a position go beyond that.
Important: That 15% refers to your position size, not your total capital. You should never risk more than 3% of your total capital on any single trade.
I encourage you, if you’re already a PRO member, you can upgrade your membership on the Discord server (at no extra cost) and get access to a fully private server dedicated to PRO members, for networking, trade ideas, insights, and alerts.
Connect PRO account with discord server
P.S.: The email you use on Discord must be the same as the one on Substack.
If you get an error or can’t make it work, message me privately, I might be able to help you out. 🙂
“One trade closer to freedom”
Vladislav