

High Probability Trades for Week 41, 2025
13 - 17 October 2025 | Edition 11

This post is available exclusively to PRO members and contains my interpretation of the watchlist along with the trading opportunities I see for the next week.
To better understand the strategy we are following and not to buy blindly without any context, please read and analyze my strategy carefully:

All the positions I take can be found in the Freedom Trades private chat.
Inside My Portfolio
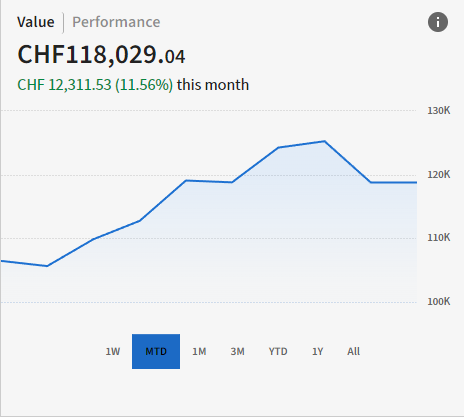
Because you pay for this newsletter monthly, I feel I have the responsibility and duty to be 100% transparent with you. That’s why I’ve introduced this format where I show you every week exactly what my portfolio looks like. (shares, total value of my portfolio, avg price - everything!)
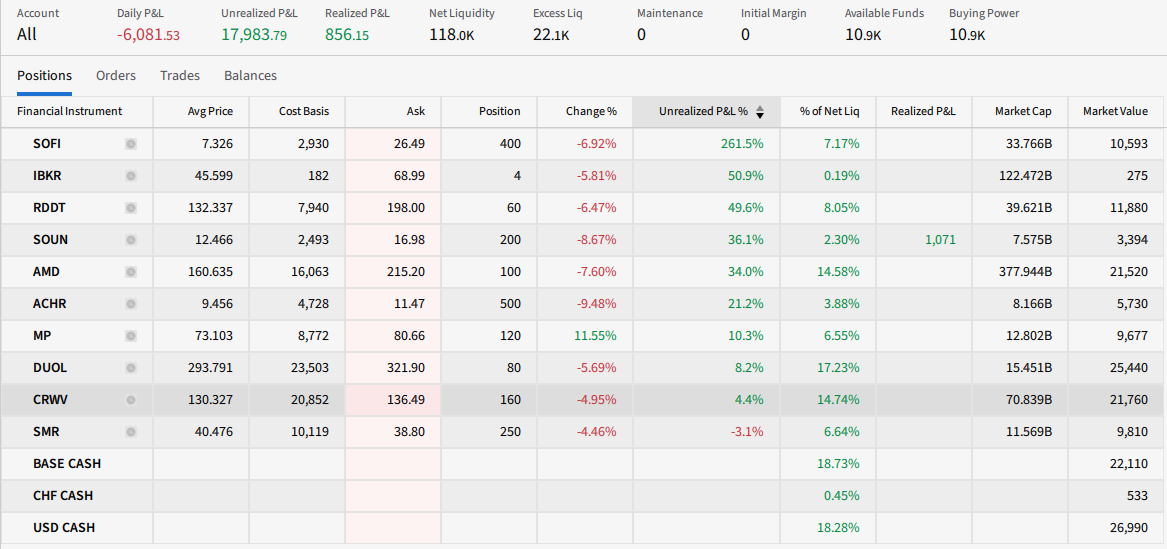
Right now, these are my positions:
Attention: since I live in Switzerland, the currency is set in CHF (which means if you convert it to USD, the amount is higher).
This Week’s Opportunities!
Even though we made money this week, we had a brutal Friday.
The S&P 500 and Nasdaq both posted their worst declines since April as investors grew concerned about the next phase of the trade war between the world’s two largest economies.
Trump also threatened “a massive increase of tariffs on Chinese products” via Truth Social and mentioned he might cancel his meeting with President Xi in South Korea later this month.
I’ve already taken action in my portfolio and raised my stop losses, added trailing stops to every position, exited FIG, and trimmed my position in SOUN.
My plan for Monday is to watch the premarket closely and open.
If I see a continuation of the decline, I’m ready to exit all positions that drop more than 15% from their previous top, as I believe this pullback could extend through the entire month. We might see our first red month after five consecutive green ones.
The only positions I’m hesitant to exit are AMD and CRWD, because I believe they’ll continue to grow in the coming months, given the strength of their sectors.
But as the saying goes, “Don’t marry your positions.” I’m ready to cut them if my thesis isn’t confirmed by the price action.
So next week, I suggest you pay very close attention to your positions, this is where the real difference between amateur and professional traders shows up: in risk management, not in “entry price.”
Also, remember this… every pullback creates massive opportunities down the road.
Cut your losing positions and wait for the right setup.
Since we’re dealing with high-beta momentum stocks, I want you to watch everything I show you here.. not jump blindly into any trade. If the decline continues, there’s a good chance I won’t enter any new positions; instead, I’ll focus on managing the ones I have and locking in realized profits.
Keep this in mind: cash is also a position.
The goal for next week is simple: don’t lose money.
Here is my full watchlist for the week:
https://www.tradingview.com/watchlists/205537178/
Ticker: LAES
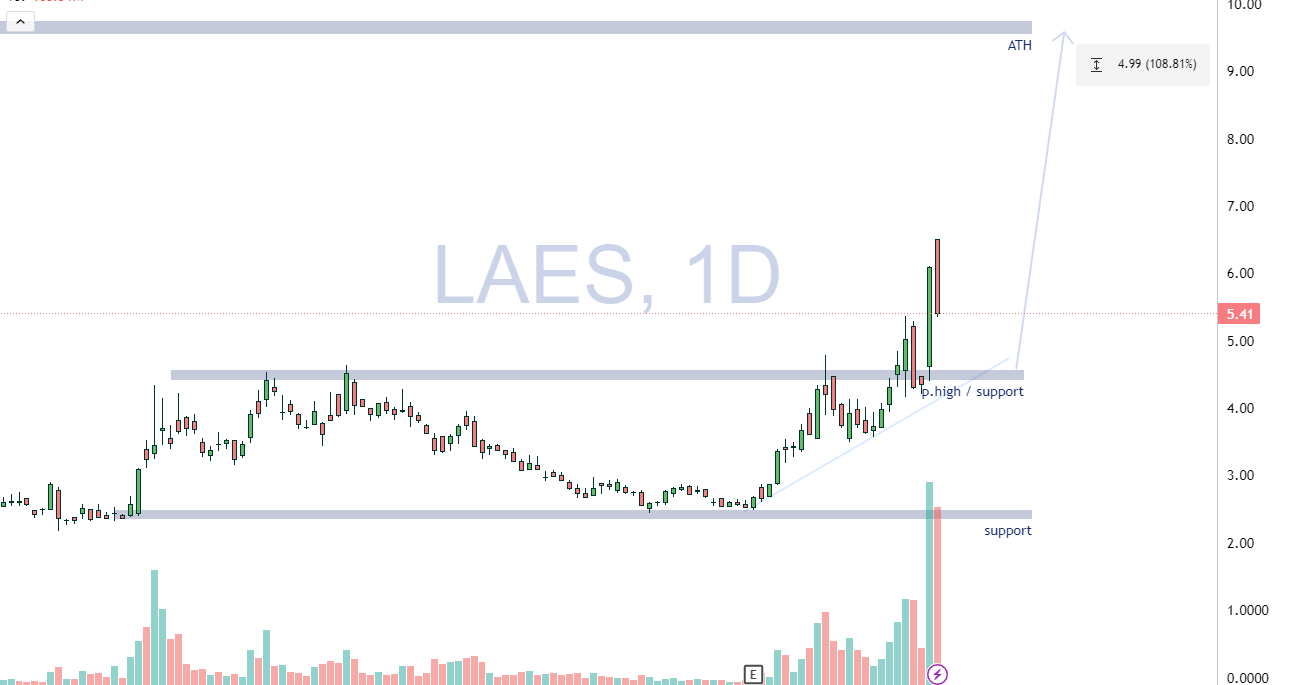
We’ll start with the riskiest opportunity,but also one of the biggest potential rewards.
Recently, LAES started showing up on the highest volume gainers screener. It checks all the boxes we’re looking for:
a fast mover (ADR 15%, too high, if you ask me),
market cap around $800M, a “cheap” price that retail traders love,
and it’s in the perfect hyped sector, semiconductors and AI.
I definitely want to get in at some point, but as I mentioned earlier, now isn’t the right time.
Since the market is pulling back, this one will likely drop even faster. So the plan is to keep a close eye on it, wait until it forms a clear support, start building a position slowly, and add once momentum returns.
That’s my general approach for this ticker, but patience will be key here.
I haven’t added specific levels yet, since it all depends on how the market behaves and how this stock reacts overall.
Ticker : EXK
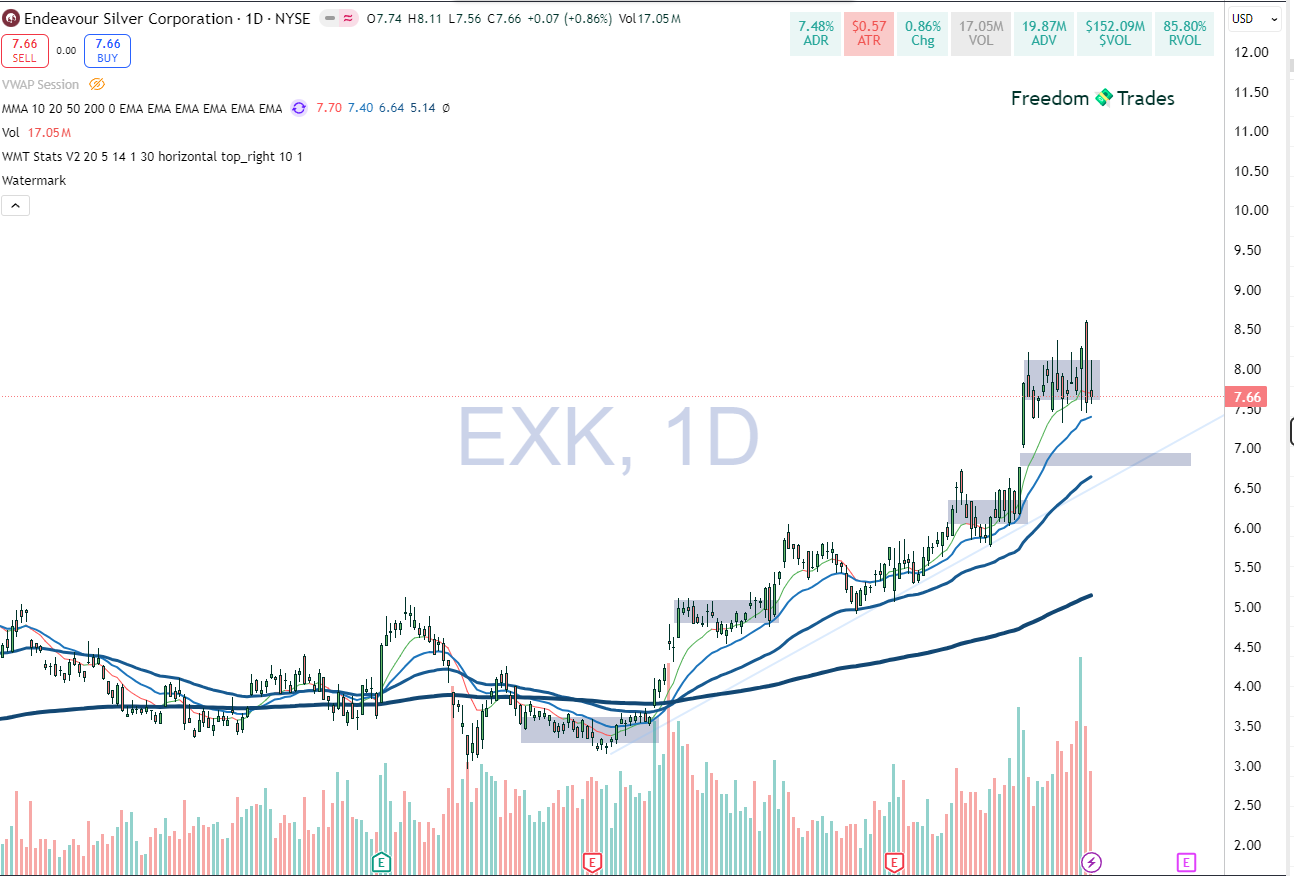
EXK is in the right sector (minerals/precious metals) and looks like it’s setting up for another breakout. Volume is picking up.
It had a clean breakout from the $6.50–$7.00 zone with strong momentum and is now sitting just under resistance, exactly what you want to see before the next leg higher.
As long as it holds above $7.00, it remains in play. A push through $8.20 with strong volume could ignite the next move toward $9–$10.
Looks like a potential continuation trade if the market cooperates.
Ticker: PATH
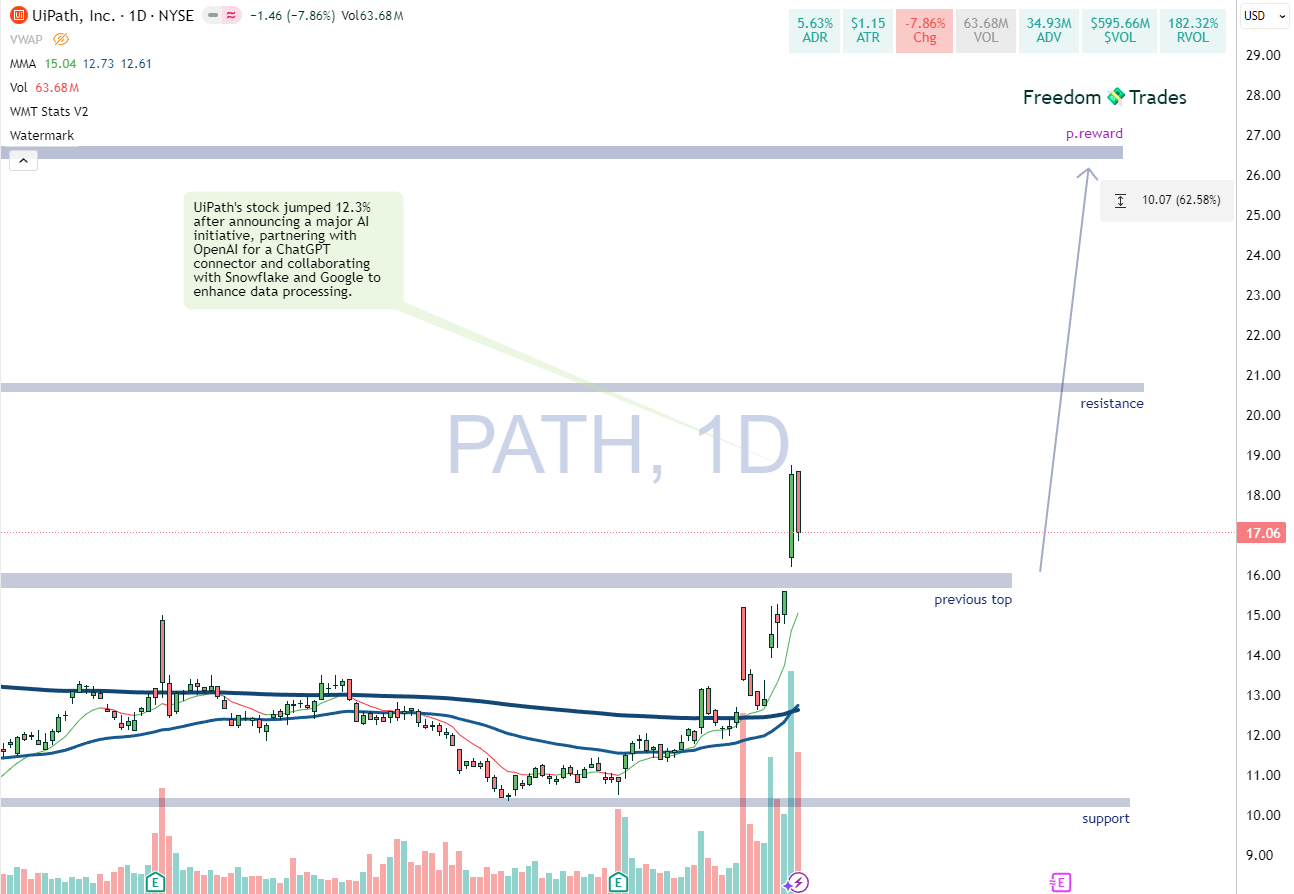
I’ve been watching this ticker for a long time, as it kept lagging and struggling to adapt to the current market environment.
Now they’ve finally started making deals with key players in the AI hype, which could be a real turning point.
We’re seeing a huge spike in volume, and I expect these partnerships to reflect positively in the next earnings report.
My plan is to find a decent entry point, ideally below $15, and start building my position gradually, holding it until December, as I expect them to beat market expectations on earnings and revenue.
So this is a long-term position, just need to wait for the right pullback.
Ticker: POET
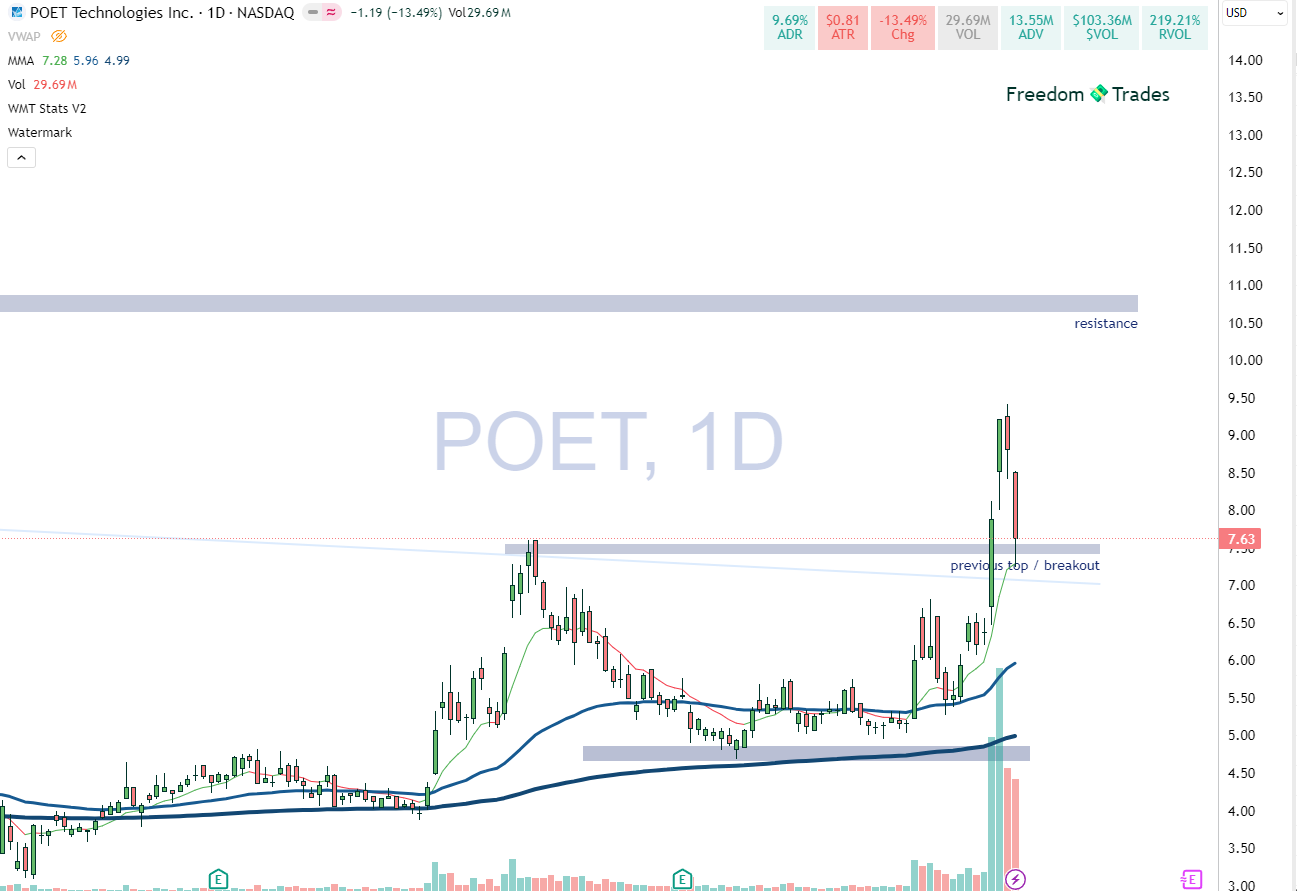
It’s still very early for POET, but we might be seeing the beginning of a momentum stock setup.
It just broke above the previous top at $7.50 with strong volume.. RVOL 219%, which is impressive.
With a market cap of only around $700M, there’s room for another explosive move to the upside, though we’ll likely get a clearer picture after this week’s price action.
So for now, I can’t say exactly where this stock is headed …it hasn’t proven itself yet, but it’s definitely one I’ll be keeping a close eye on.
Ticker: RR
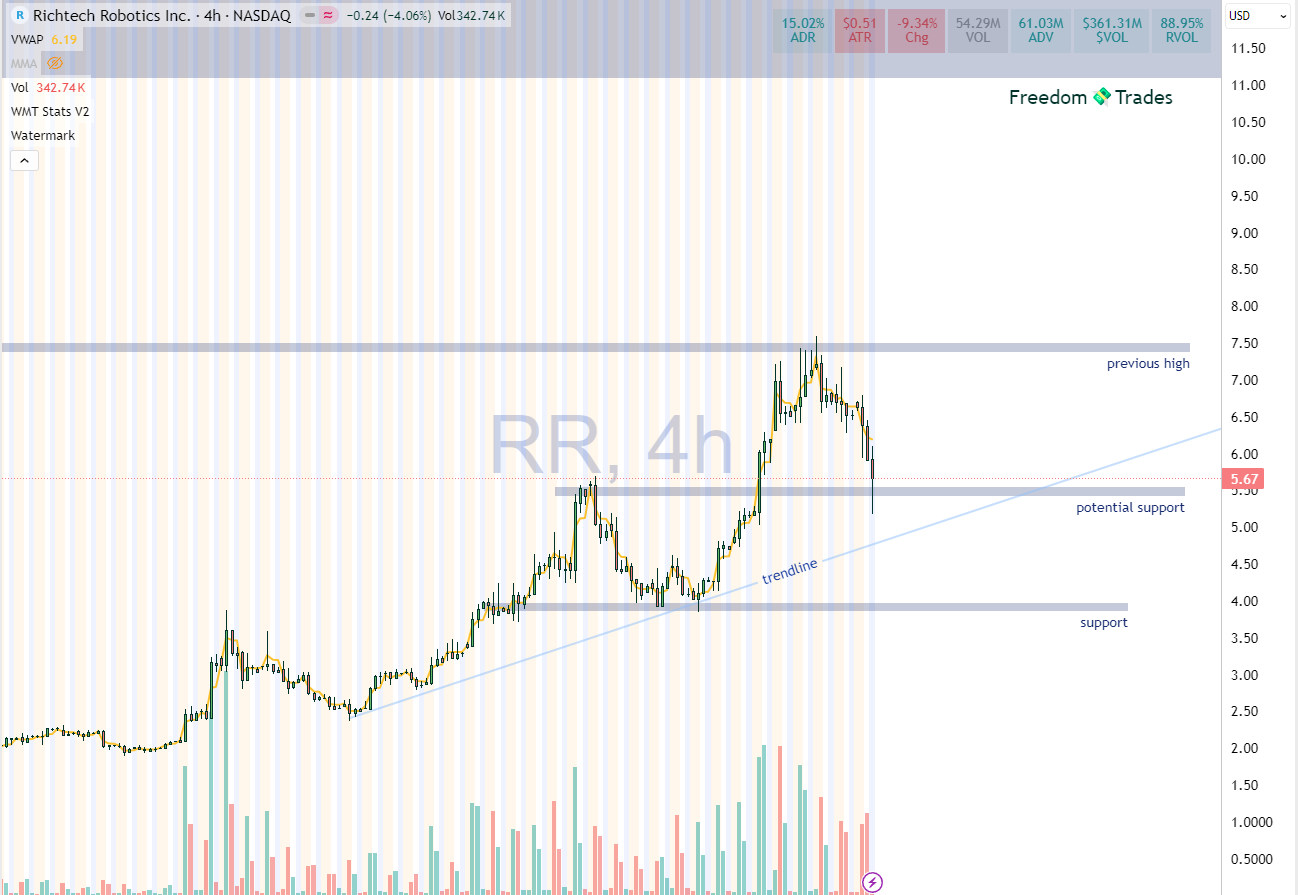
Same with RR, I think we can catch another momentum wave once it pulls back to a decent level and the market starts working in our favor again.
Until then, all these lines are just rough estimates.
Let me say this again at the end of this post:
Be cautious! Don’t jump into positions this week, the probability of a breakout is very low for high-beta momentum stocks when the overall market isn’t supporting the move!!
HELP: How to interpret the chart
All charts are daily or weekly timeframe. (check the watermark)
The gray/blue zone marks support and resistance.
The slim blue lines are trend lines
The moving averages used are 200 EMA, 50 EMA, 20 EMA, and 10 EMA.
The 200 EMA is the most important for trend direction.
The 10 EMA is used for exits, if you are in profit and the price closes below the 10 EMA on a daily close, exit the position. (wait for EOD before closing)
Place your stop loss at -10%. For an A++ setup, you can extend it to -15%, but never let a position go beyond that.
Important: That 15% refers to your position size, not your total capital. You should never risk more than 3% of your total capital on any single trade.
Many of you wrote to me saying you’d like us to have a Discord server where we can connect. I heard you. and I’ve just created one.
All of you who are PRO, send me a direct message and I’ll give you a special role that unlocks a private channel where we can connect and share daily market opportunities.
“One trade closer to freedom”
Vladislav
Thanks for all the transparency, Vladislav !! Just some more info - when did you start this portfolio - 40 weeks ago ? And what was initial capital - could you also consider adding intial buy date beside each position - so new comers may consider latest positions