

High Probability Trades for Week 46, 2025
17 - 21 November 2025 | Edition 17

This is the current value of my swing trading account.
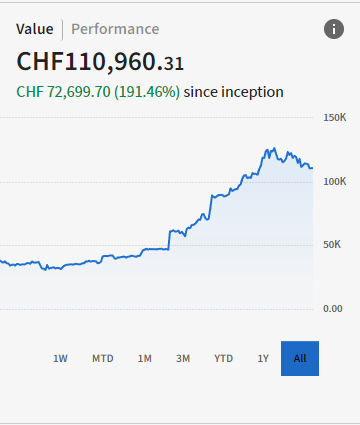
Attention: since I live in Switzerland, the currency is set in CHF (which means if you convert it to USD, the amount is higher).
To better understand the strategy we are following and not to buy blindly without any context, please read and analyze my strategy carefully:

All the positions I take during the week can be found on the Discord server or in the Freedom Trades private chat.
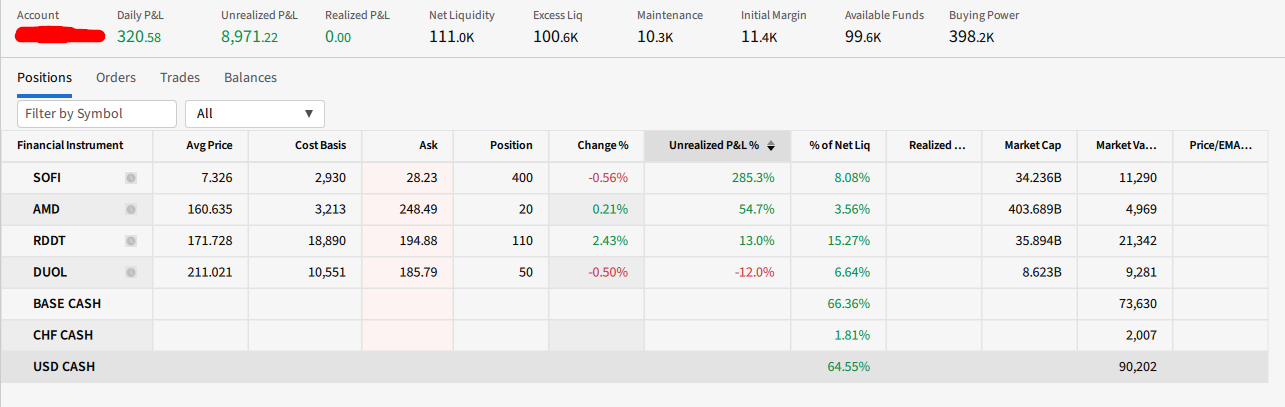
Right now, these are my positions:
You can copy my watchlist here: https://www.tradingview.com/watchlists/209731393/
This Week’s Opportunities!
In weeks like this one, when uncertainty is high, major indices are pulling back, and long opportunities are scarce, the need for a report that shows us the true direction of the market and tells us whether we should be defensive or aggressive becomes even more important.
The first person who mentioned something like this, and who actually gave me the idea, was a member of our community, Rosimo, thank you for that!
With that in mind, I’m planning to create a weekly format where, alongside the high-probability trades, you’ll also get a clean market-direction overview that will help you:
Identify whether it’s a good week for swing trading or to stay on the sidelines
See the true structure of the market, not just the surface
Anticipate rotations before they appear on the charts
Build discipline and consistency
At the moment, to identify market environment, I personally monitor the following:
SPX (S&P 500) – Measures the largest 500 U.S. companies; the main market barometer.
NDX (Nasdaq 100) – Big tech index; shows “risk-on / risk-off” sentiment in tech.
DJI (Dow Jones Industrial Average) – Defensive blue-chip index.
RUT (Russell 2000) – Small-cap index; reflects real risk appetite and domestic economic health.
VIX – The “fear index”; measures expected volatility, when it rises, markets fall.
BTCUSD – Bitcoin.
DXY (US Dollar Index) – Shows dollar strength; when DXY rises, equities and crypto tend to pull back.
GOLD – Safe-haven asset; rises during risk aversion or inflationary pressure.
TNX (10-Year Treasury Yield) – Drives valuations and liquidity; extremely important.
TYX (30-Year Treasury Yield) – Shows long-term inflation expectations and Fed outlook.
WTI (Crude Oil) – When it spikes, inflation risk increases and equities come under pressure.
HYG (High-Yield Bonds ETF) – Junk bonds; a risk indicator. When HYG falls, equities typically follow.
Sector performance (weekly & monthly) – To identify market rotations and trends.
The plan is to present this report in a single, easy-to-read image, so you can reach a clear conclusion in under 3 minutes.
The purpose of this report is to simplify your research, what used to take 2–3 hours will now take 3 minutes.
Now I want to ask you: what’s missing from this report? Are there any other indicators or metrics, for example breadth divergence / AD-Line, that you use and would like to see included?
I need your feedback to make this as valuable as possible. Please write to me on the Discord server.
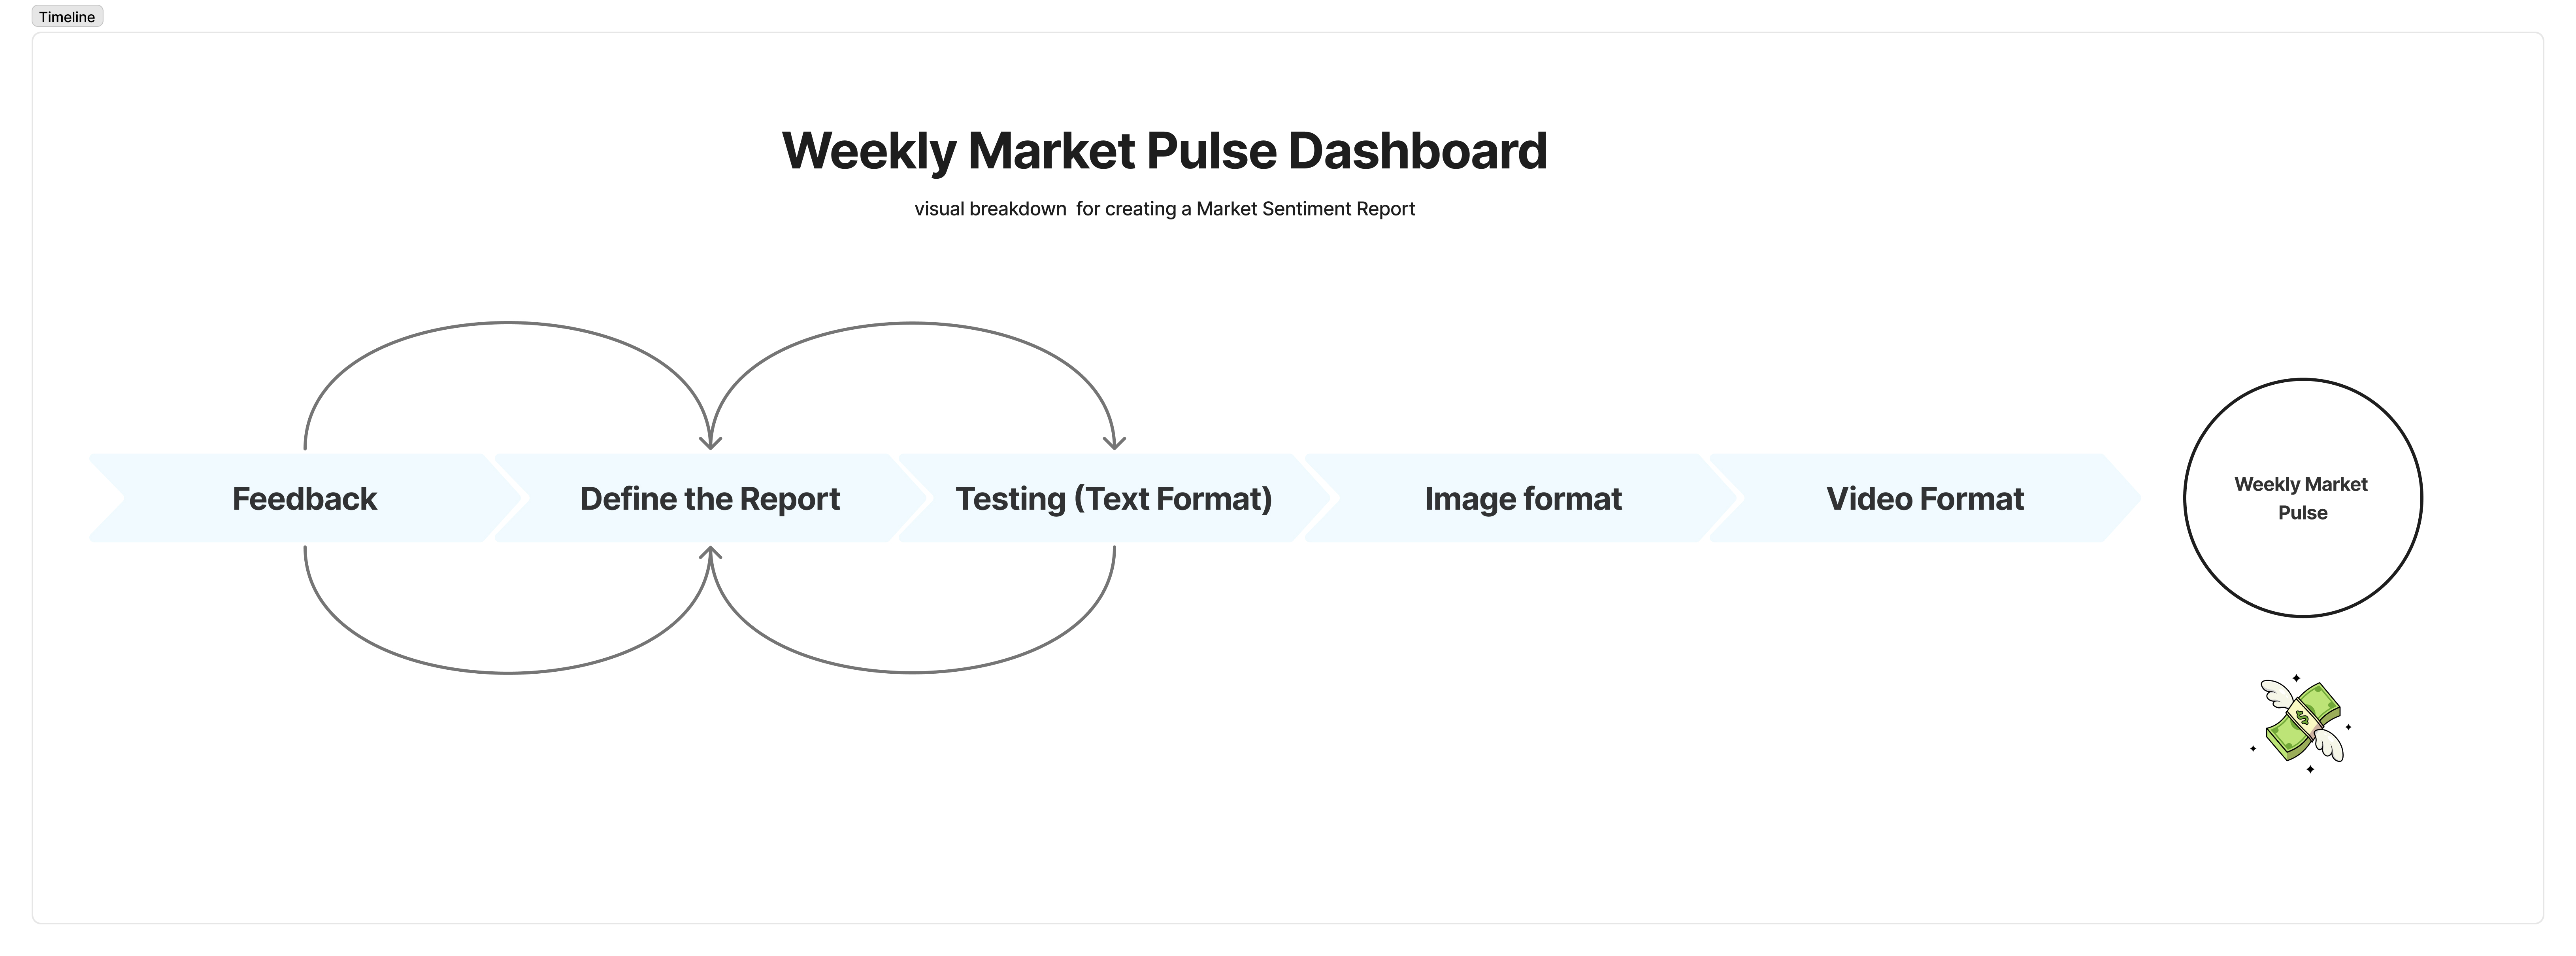
This is the process I will follow.
For this week, I will keep some of the last week recommendations and add one more, as I cannot recommend something I wouldn’t personally take just for the sake of filling this report with extra tickers that are completely untradable.
I am verry bullish on: META, NFLX and NBIS. However, I do not have shares in any of them. I am attempting to be patient and build my position gradually, as I am planning to use most of my buying power on these names.
Ticker: $NBIS
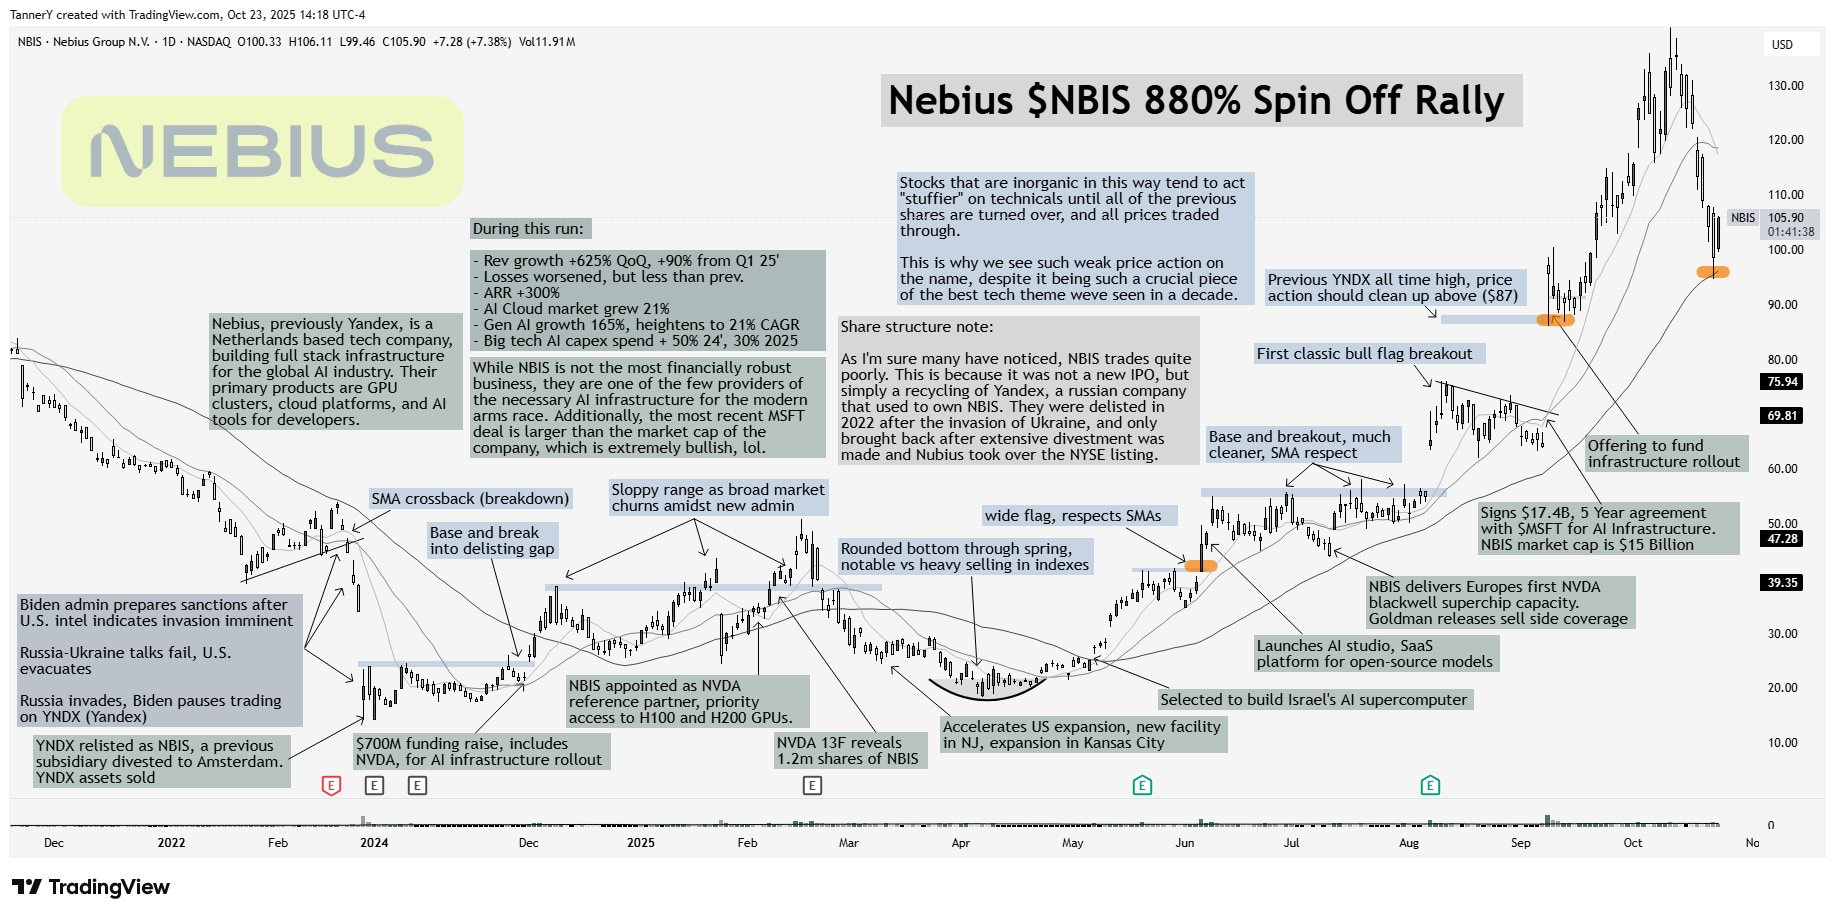
Please study the cart above.
I believe NBIS is one of the few providers of the necessary AI infrastructure. The catalysts and deals they’ve secured recently are extremely bullish. If this AI trend continues, I think we could soon see NBIs at $160.
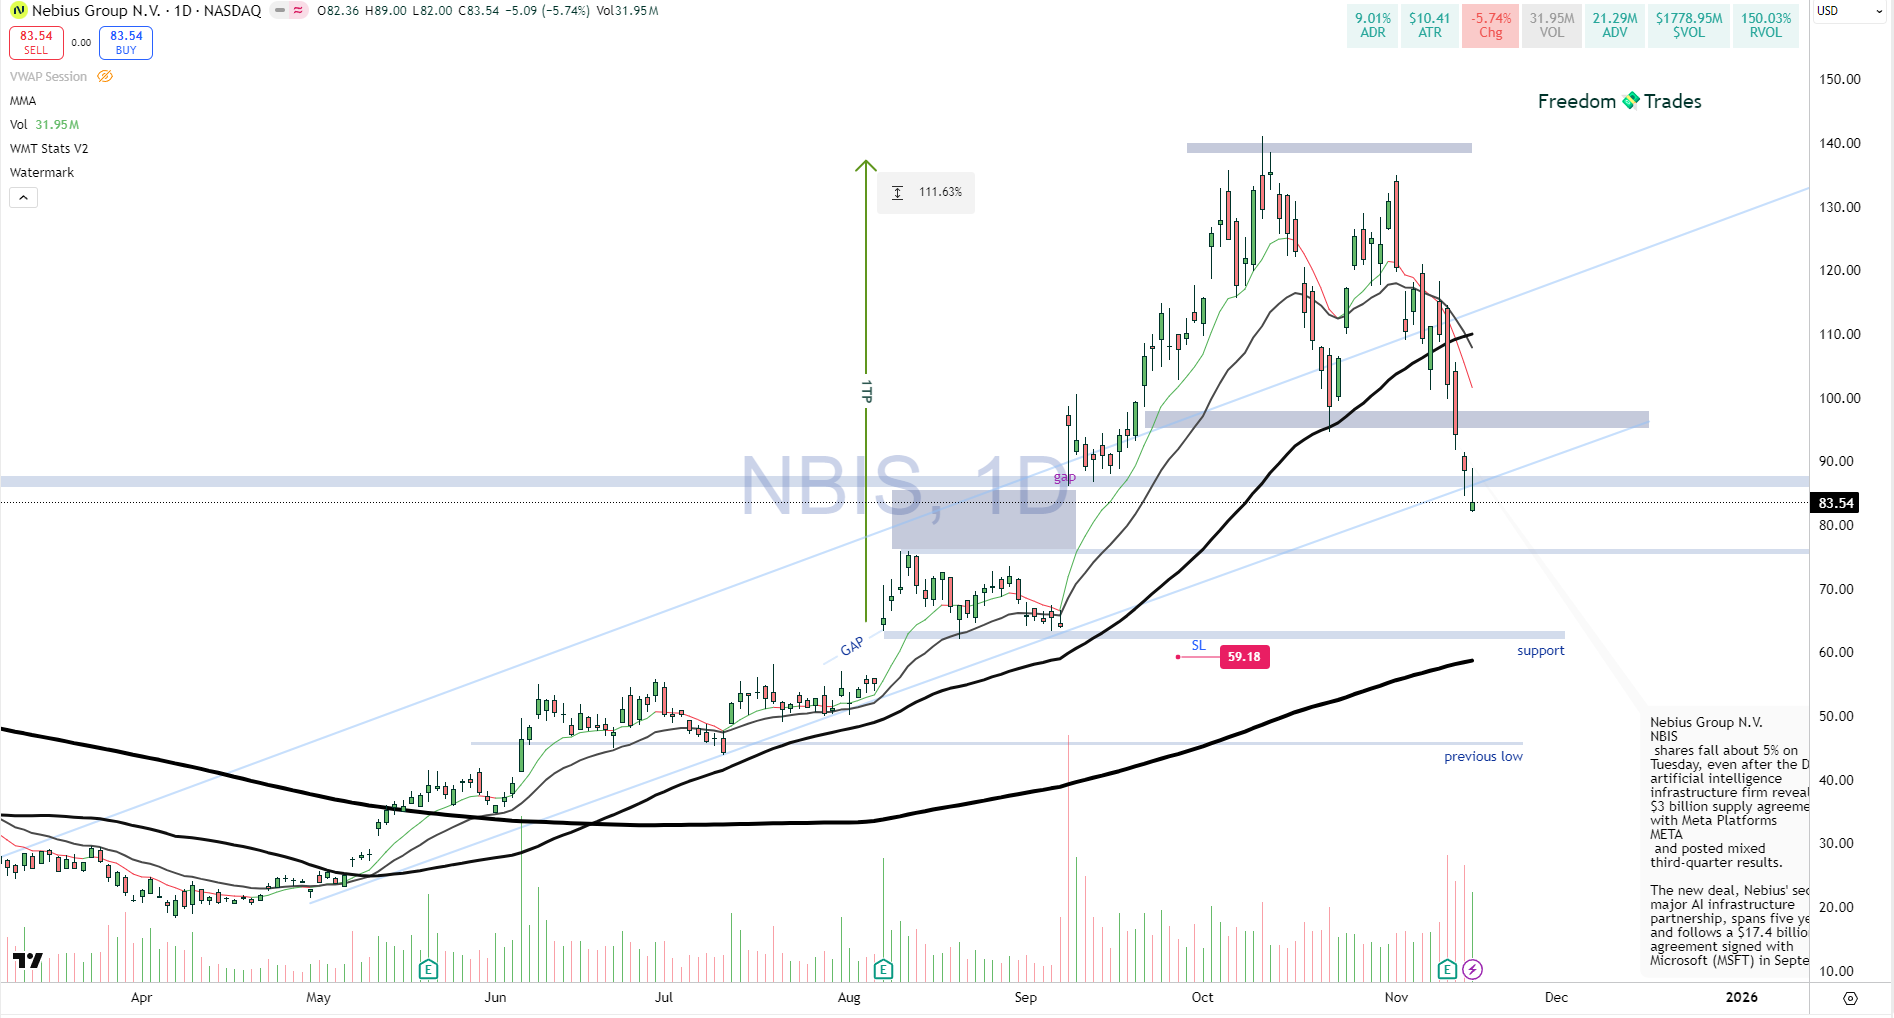
I personally want to start accumulating between $75 and $90, anything below that is a good price to pay.
Ticker: META 0.00%↑
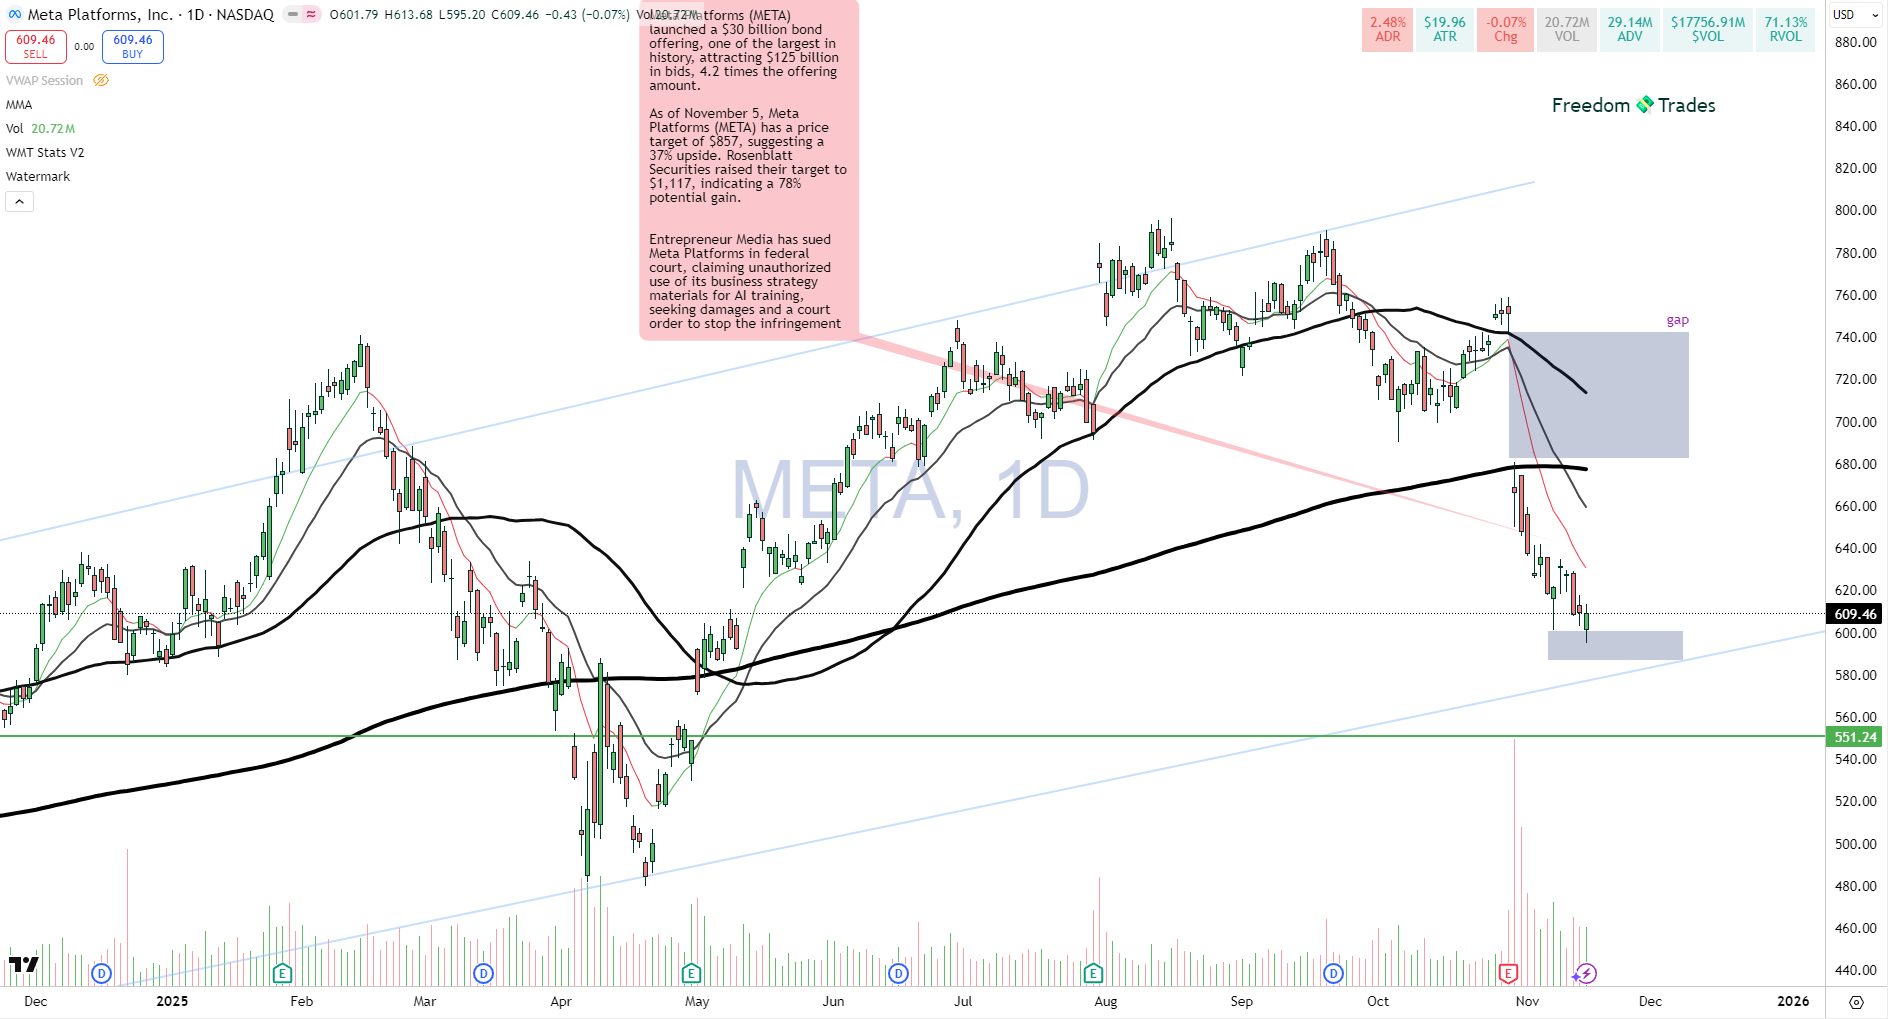
Meta is becoming more and more attractive to me. It’s getting very close to the trendline that has held since November 2022, almost three years now. This level will act like a reversible magnet that pushes or bounces the price (at least in the short term). When something is this obvious, many traders will react to it in a similar way.
It will be interesting to watch how it reacts.
Personally, I believe anything between $550 and $600 is a very good buy for META.
It’s approaching that level, and if it continues to pull back, I will most likely start accumulating next week.
I want to mention this ticker because it’s important to keep an eye on it… it’s one of the MAG 7. Any pullback here represents a rare opportunity to enter one of the “safest” tickers out there.
That gap needs to be filled, and statistically around 60% of gaps eventually get filled (especially on mega large-cap stocks like this one). One way or another, it will be filled , the only problem is that we don’t know when.
This could turn into a great opportunity, especially for those using leverage, options traders or single-stock leveraged ETFs, to boost that ADR%.
Ticker: NFLX 0.00%↑
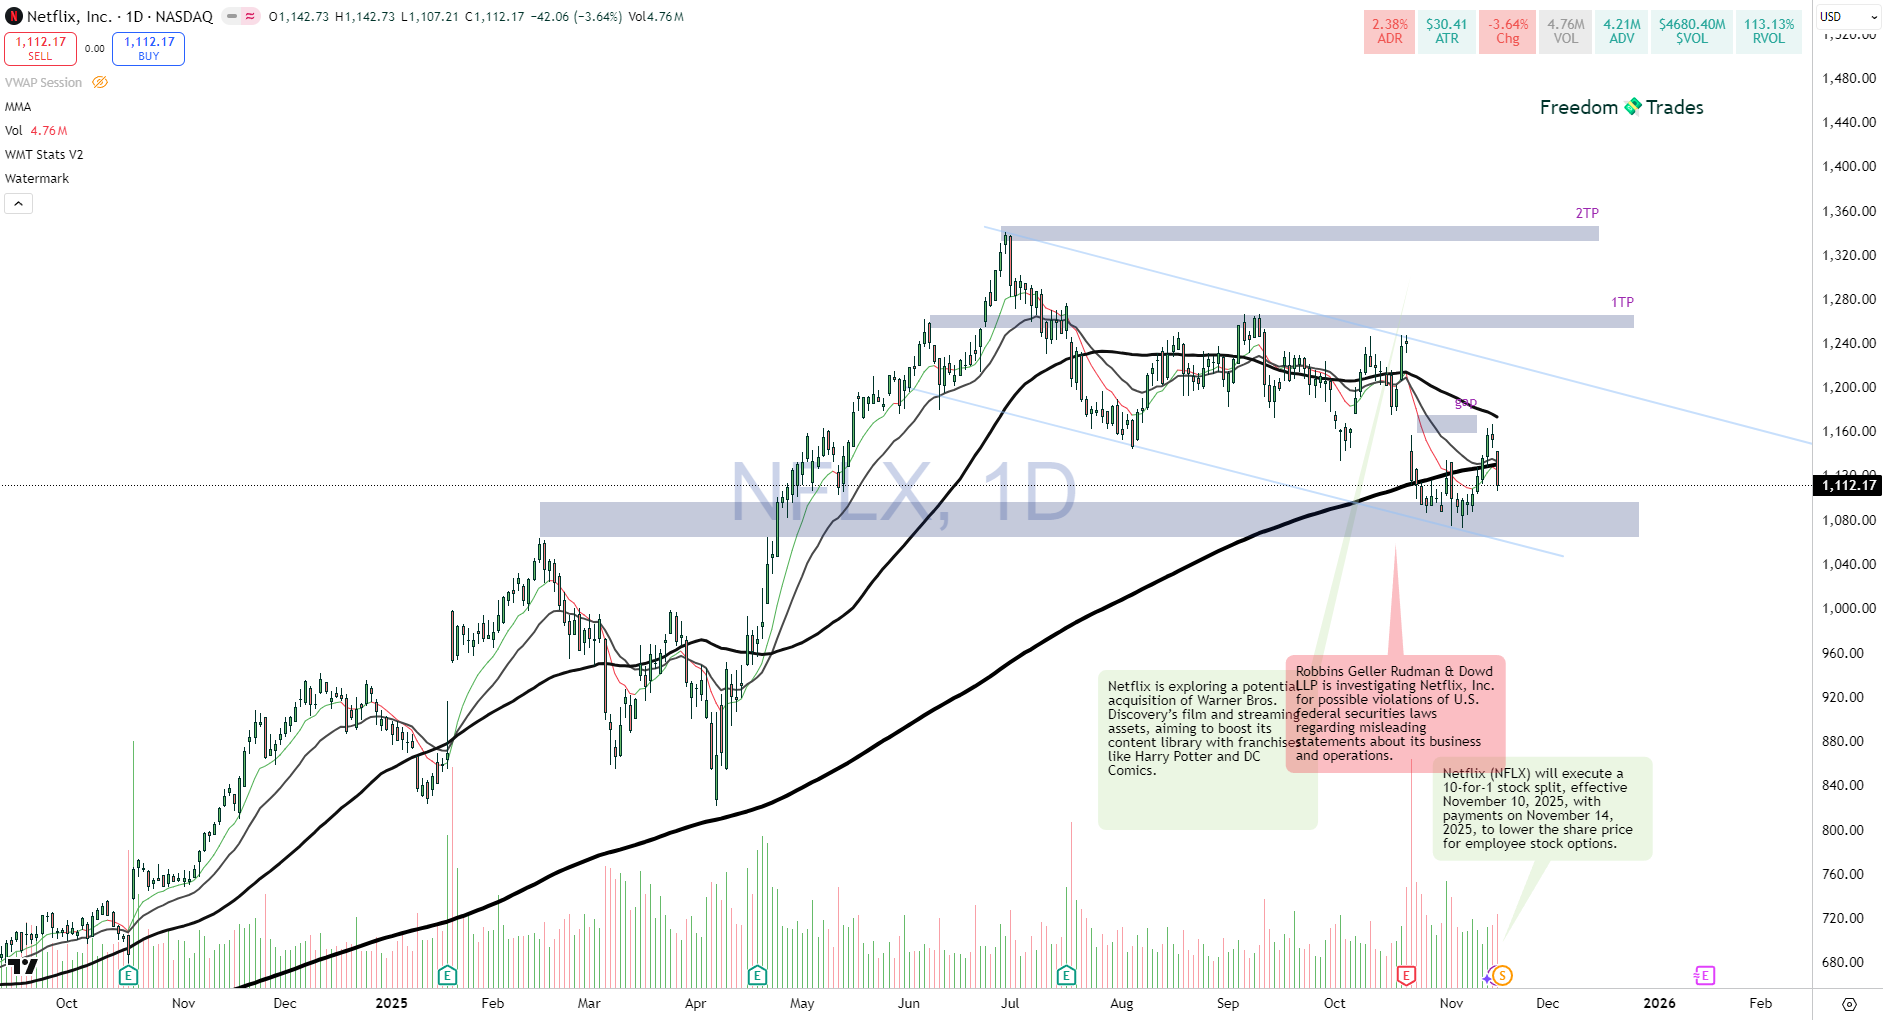
Setup Score: 90 / 100 🟢 AA+ Setup
On Monday we’ll have a 10-for-1 forward split on Netflix, which is typically a bullish sign.
If we look at the most recent times when Netflix dropped below or touched the 200 EMA, we can see that it didn’t stay there for long. This was the case in April 2025, August 2024, and even October 2023.
Now, if the market helps us and the general direction remains positive, we could see a quick recovery toward the first take profit (TP), offering a potential reward of around 12% for TP1 and approximately 20% for TP2.
However, the issue is that the ADR (Average Daily Range) is currently around 2%, which makes it a slow mover. We don’t want to keep money parked in something that, on average, only moves 2% per day. To reach that 20% target, we might need to stay in this trade for quite a while, possibly 2-5 months.
One way to accelerate that ADR would be to look at the NFLU ticker, which represents Netflix 2X Long. Essentially, it moves twice as much as Netflix, which can amplify your gains … but be careful, because it also amplifies your losses.
If Netflix loses 50% of its value, you would effectively be liquidated, since this is a leveraged product. So make sure you size your position carefully!
Also, for those trading options, this setup can definitely be used to your advantage.
Important links to read and understand:
🟢How to define whether a setup is A+, A, or B. (Click here)
Soon I will add more to this category..
Context
Check the chart watermark to identify the analysis timeframe.
The gray/blue zone marks support and resistance.
The slim blue lines are trend lines
The moving averages used are 200 EMA, 50 EMA, 20 EMA, and 10 EMA.
The 200 EMA is the most important for trend direction.
The 10 EMA is used for exits, if you are in profit and the price closes below the 10 EMA on a daily close, exit the position. (wait for EOD before closing)
You are free to choose/decide when to take profits, but the most important is to place your stop loss at -10% (from entry price / avg price if you dont enter with full size).
For an A+ setup, you can extend it to -15%, but never let a position go beyond that.
Important: That 15% refers to your position size, not your total capital. You should never risk more than 3% of your total capital on any single trade.
I encourage you, if you’re already a PRO member, you can upgrade your membership on the Discord server (at no extra cost) and get access to a fully private server dedicated to PRO members, for networking, trade ideas, insights, and alerts.
Connect PRO account with discord server
P.S.: The email you use on Discord must be the same as the one on Substack.
If you get an error or can’t make it work, message me privately, I might be able to help you out. 🙂
“One trade closer to freedom”
Vladislav