

High Probability Trades for Week 37, 2025
15 - 19 September 2025 | Edition 7

This post is available exclusively to PRO members and contains my interpretation of the watchlist along with the trading opportunities I see for the next week.
To better understand the strategy we are following and not to buy blindly without any context, please read and analyze my strategy carefully:

Inside My Portfolio
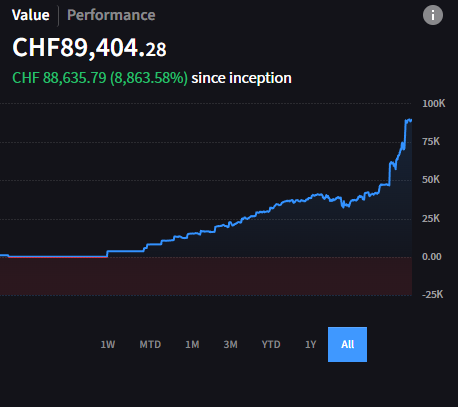
Because you pay for this newsletter monthly, I feel I have the responsibility and duty to be 100% transparent with you. That’s why I’ve introduced this format where I show you every week exactly what my portfolio looks like. (shares, total value of my portfolio, avg price - everything!)
Right now, these are my positions:
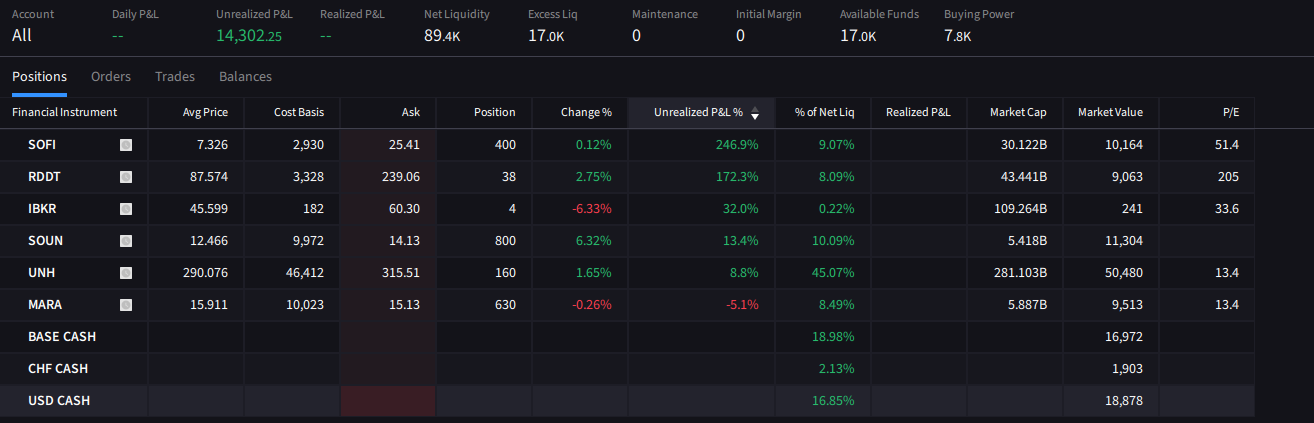
Attention: since I live in Switzerland, the currency is set in CHF (which means if you convert it to USD, the amount is much higher).
This Week’s Opportunities!
Please do not open any large-sized positions this week if you’re not sure about what you’re doing!!
We’ve got the Fed’s rate cut decision on Wednesday, which means there will be volatility. A perfect environment for a trader, but also dangerous, especially for a beginner. Be careful!!
Ticker: CRWV 0.00%↑
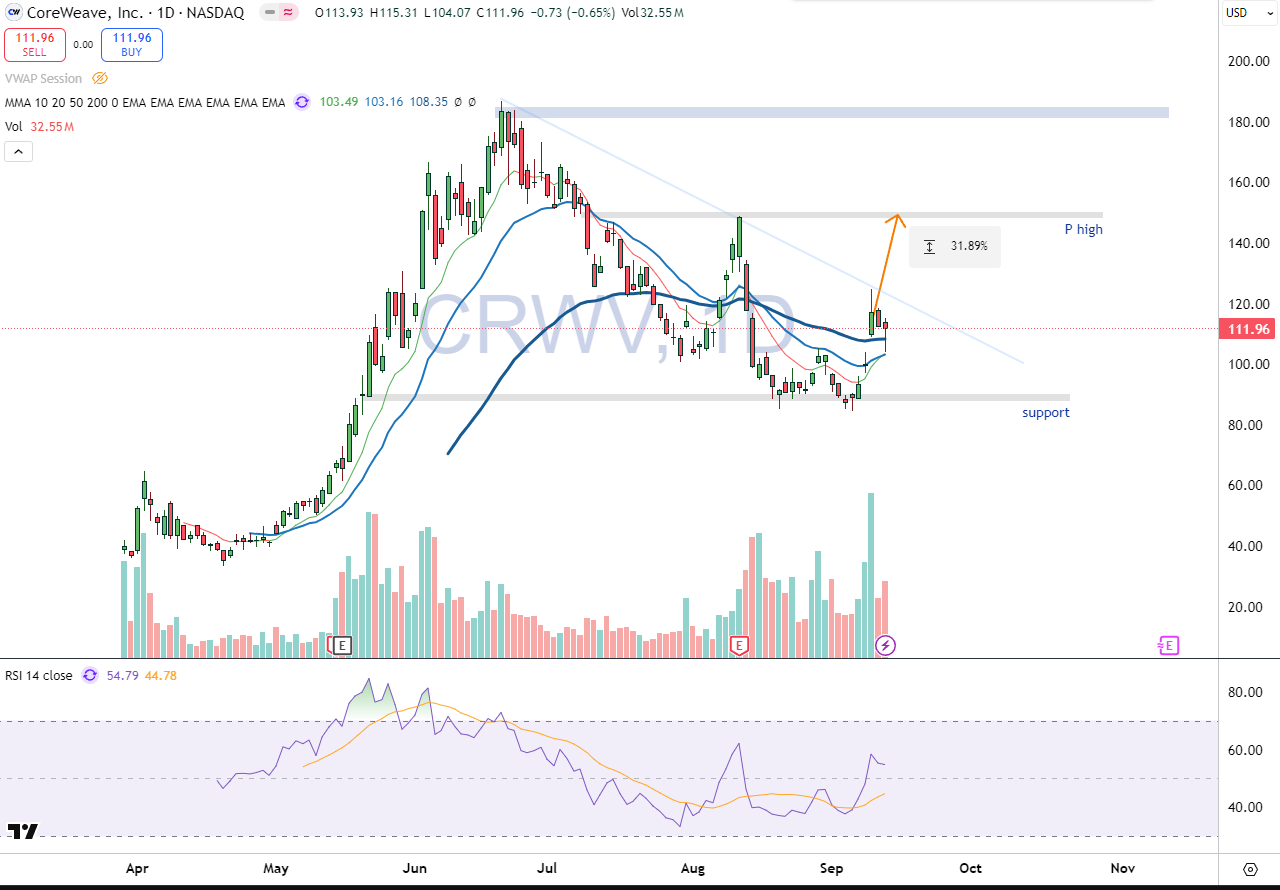
If CRWV manages to break this downtrend, we could see a retest of the $150 zone and then momentum toward $180. Be careful with this ticker, it’s super overhyped, but volume is increasing, which signals a potential accumulation zone.
I also like that last candle and how it closed on Friday.
Ticker: AMPX 0.00%↑
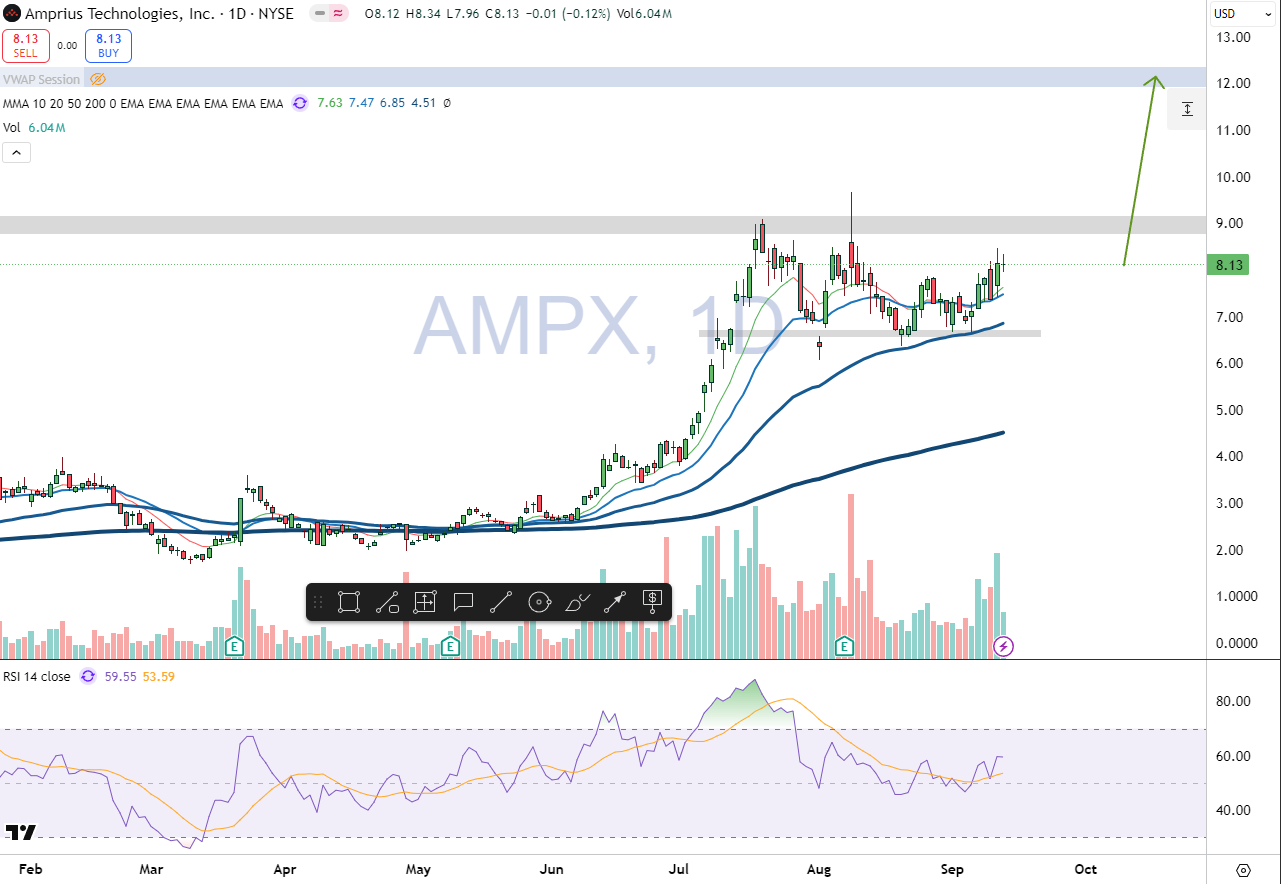
It’s setting up for the next leg. It has formed support around the $7 zone and could retest the next levels at $9 and then $12.
Be careful when buying in the middle of the range, because you’ll be forced to use a wider stop. Keep an eye on it… and manage your risk. Don’t set a stop wider than 10%.
Ticker: SERV 0.00%↑
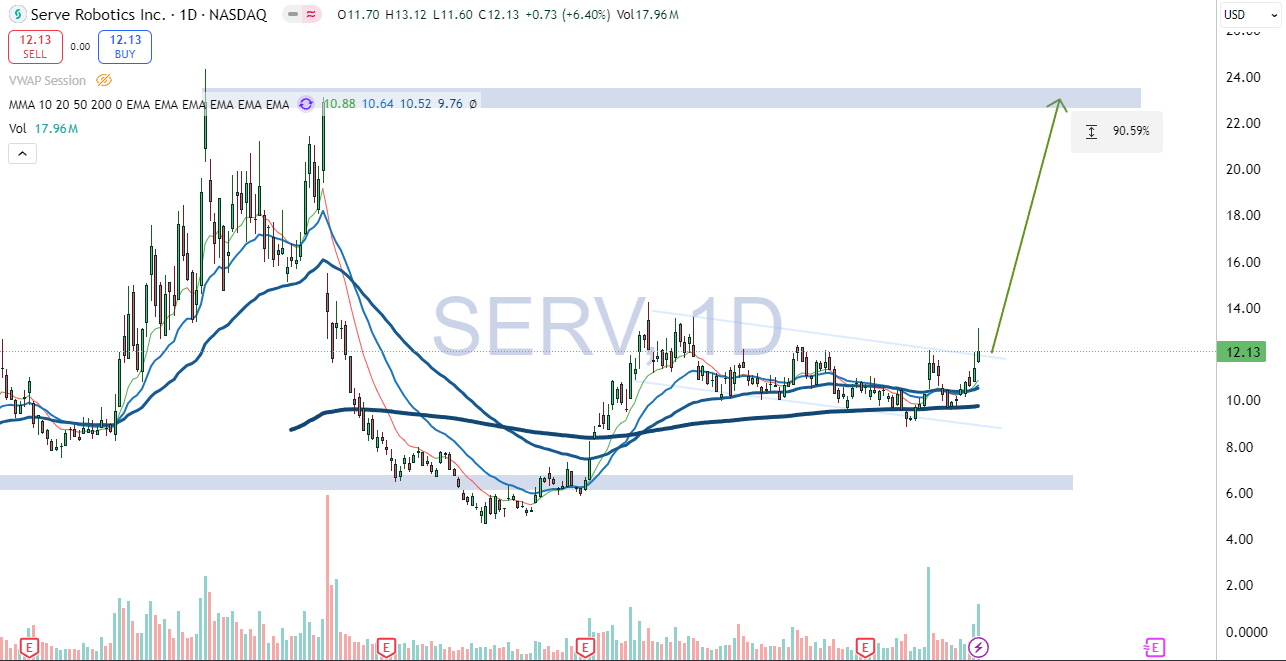
Since this is a breakout play at the high of the breakout, here’s how I would approach this ticker:
I’d start with a smaller position than I ultimately want and build into it as it goes down, while making sure it doesn’t drop below the key $8.50 level, which would invalidate the move.
And if it does break out, I’d add on every minor pullback, with a potential reward of 90% if it pushes aggressively to all-time highs (unlikely, but possible if the market decides the next trend is Humanoid/robot stocks).
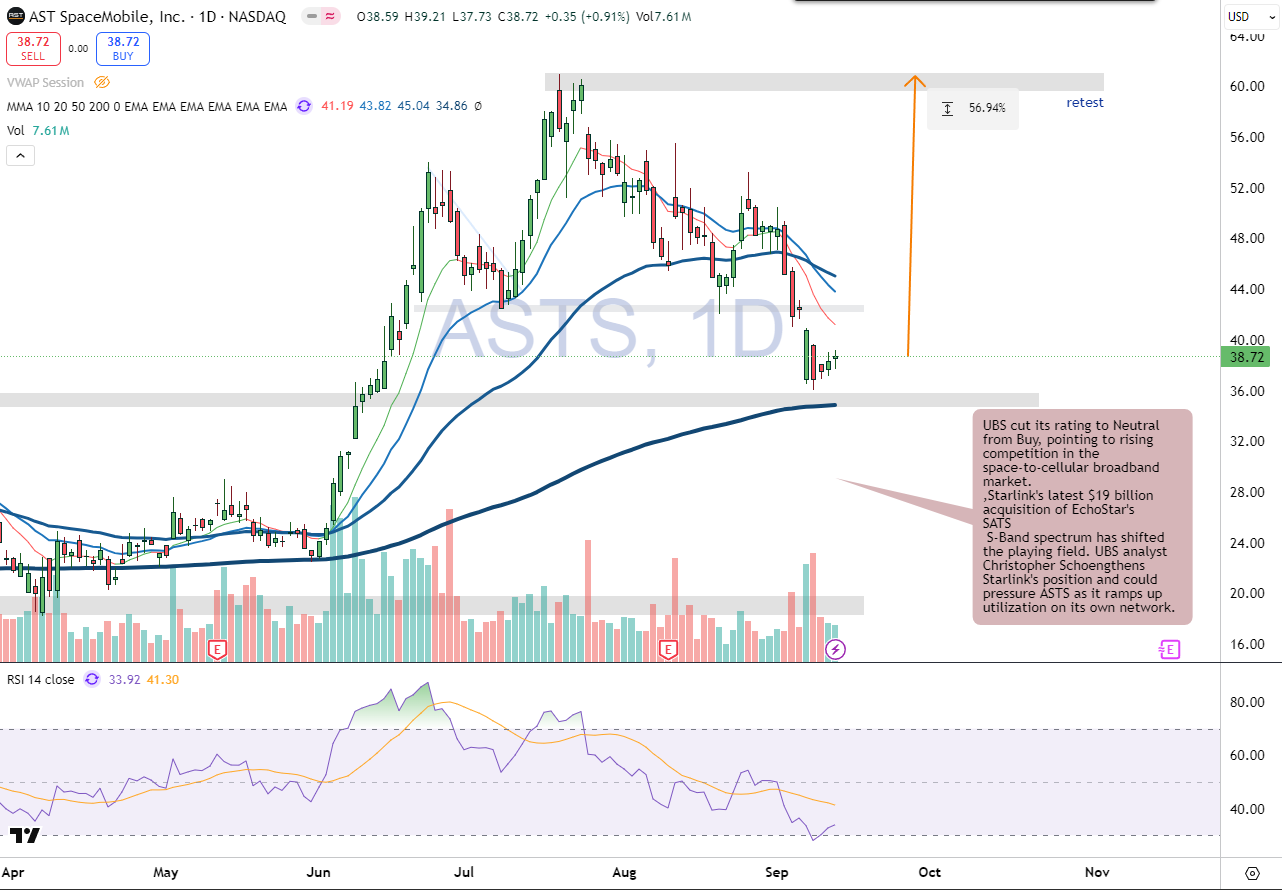
Ticker: ASTS 0.00%↑
This could be a nice reversal if it turns out the market just overreacted to the news that Starlink bought EchoStar’s SATS. Even if it turns out the market reacted correctly to the news, there are still plenty of traders stuck at the all-time high. I also like that bounce off the 200 EMA. I wouldn’t take a position just yet…I want to see a bit more follow-through, but I’m keeping my eyes on this ticker.
Ticker: MARA 0.00%↑
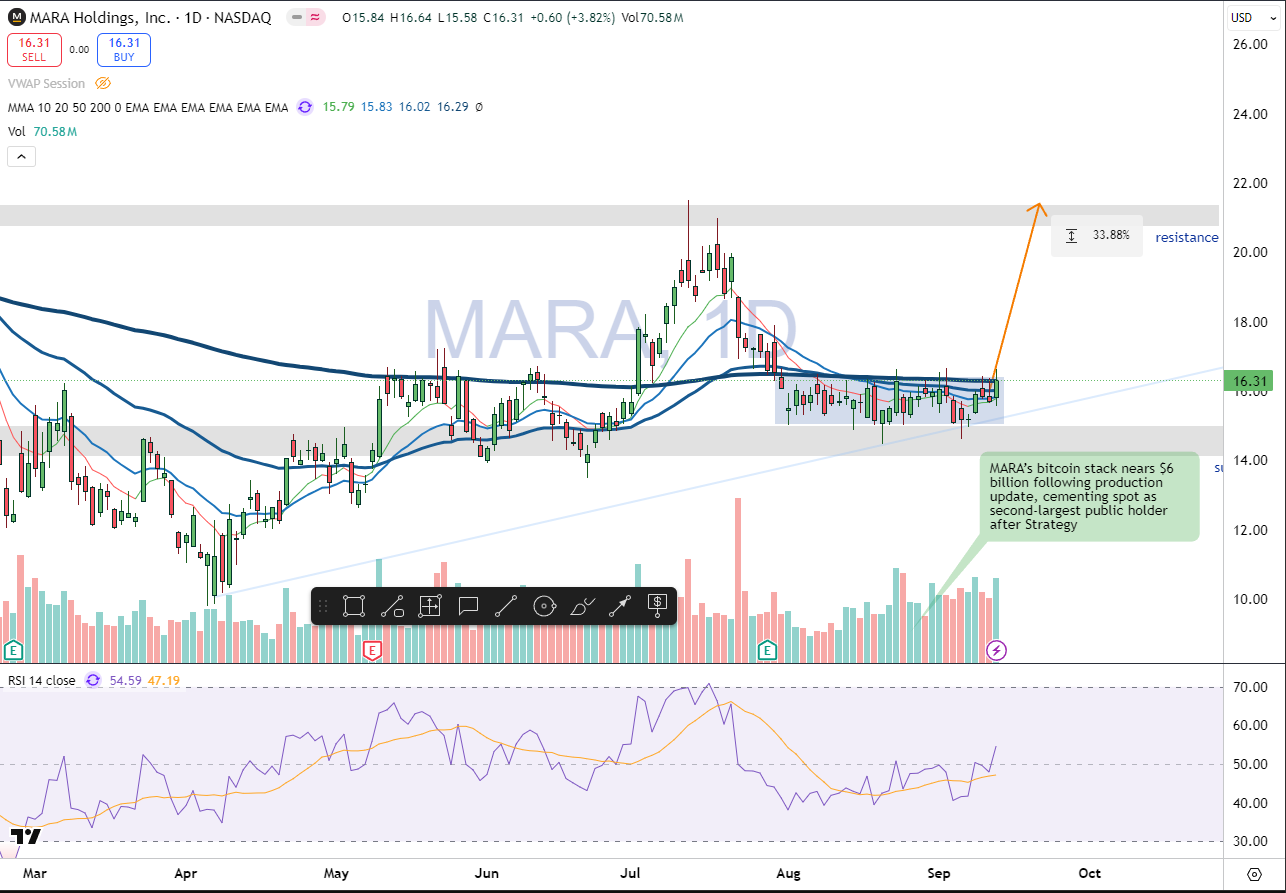
We’re not losing on MARA, but we’re not winning either.
It seems like it doesn’t want to break out of this range, even though volume has been steadily increasing and BTC has started climbing, trying to retest the previous ATH. We’ve been in this position for 3 weeks now, patiently waiting to see if it respects the trendline and retests resistance.
All I can do is wait and manage my risk.
Ticker: JOBY 0.00%↑
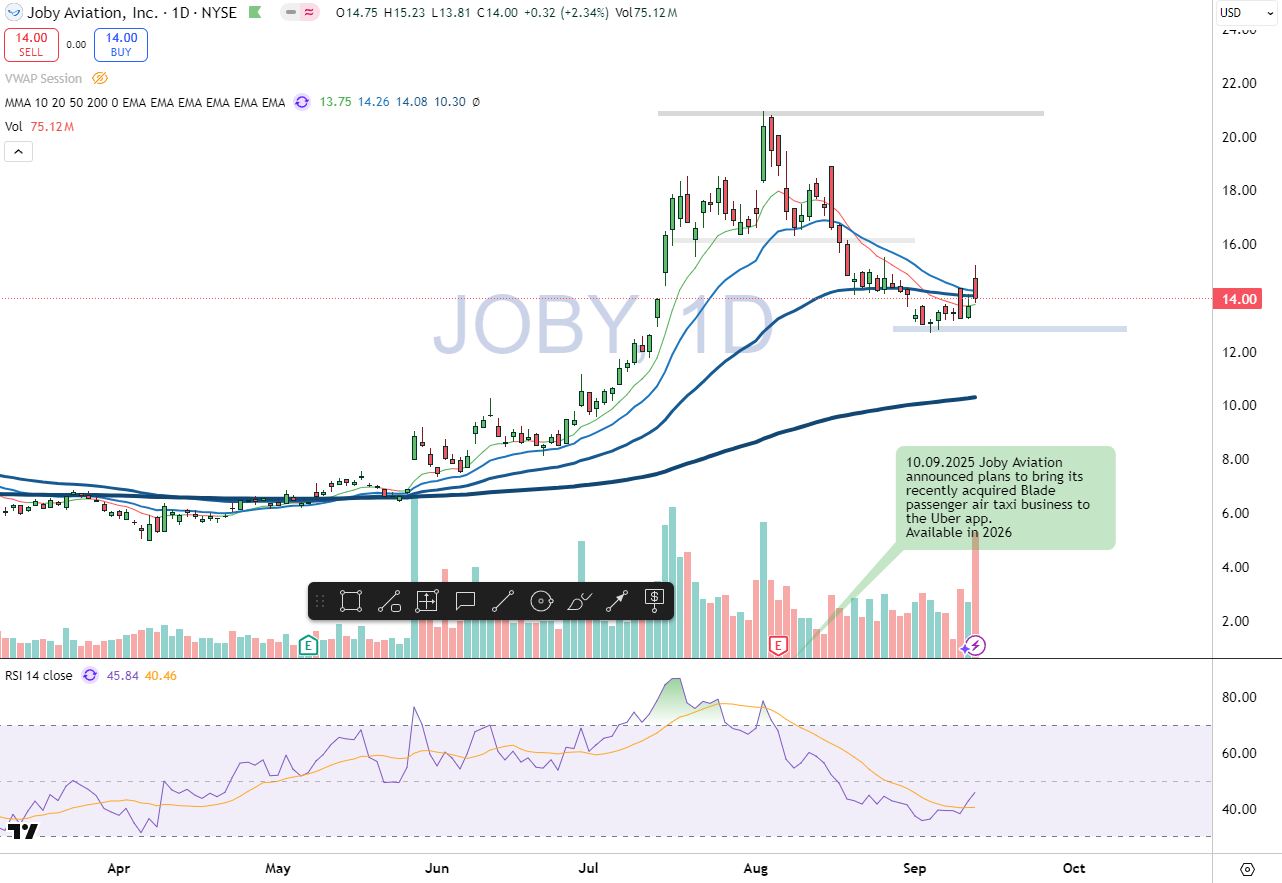
After JOBY announced its partnership with UBER, I entered a position of 700 shares. I won’t lie, I was expecting a stronger reaction from the market, but as long as it manages to hold support at the $13 level, I’ll stay in the position. Potential 50% reward if it manages to retest the previous all-time high.
Ticker: DUOL 0.00%↑
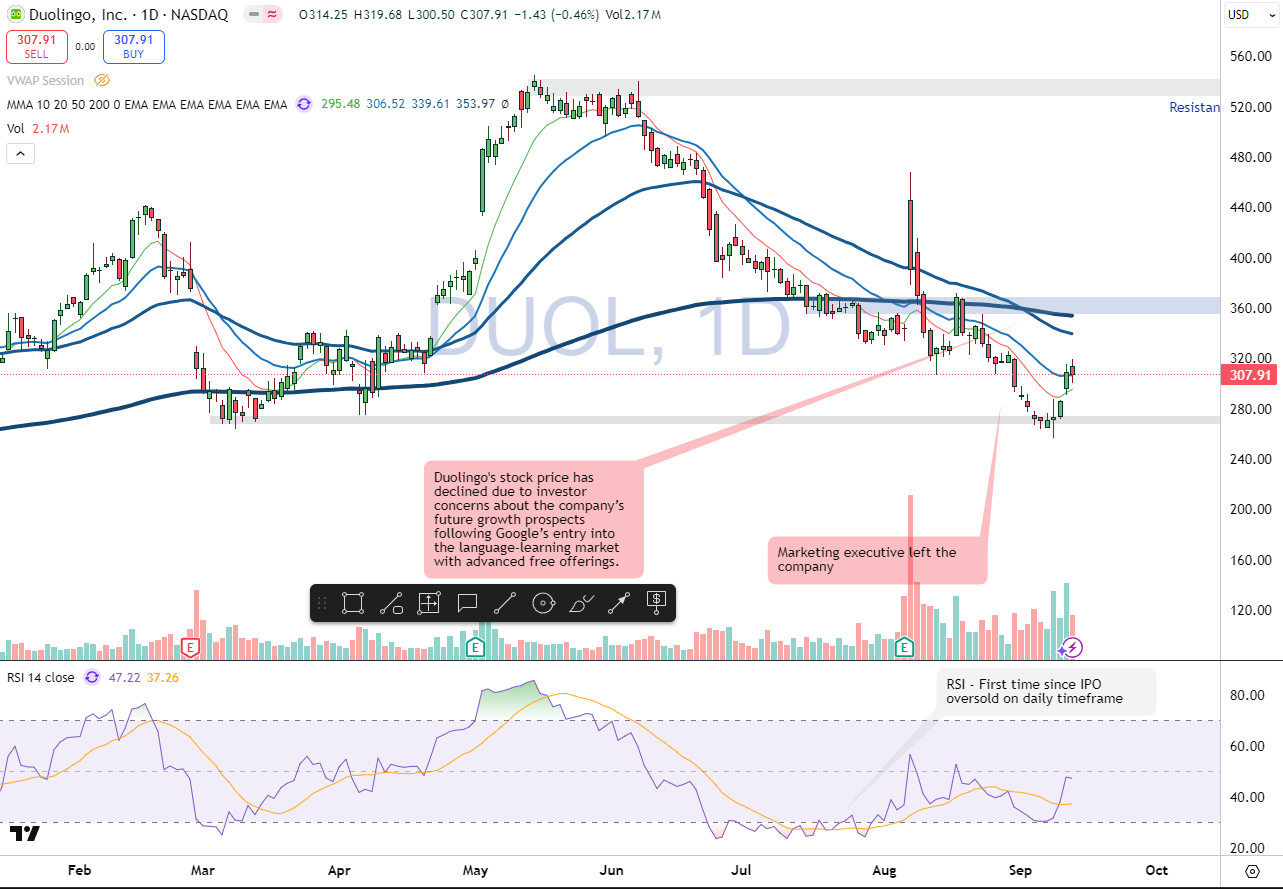
The market fears that Duolingo will lose ground to AI and Google, and on top of that, their marketing executive left the company. That’s why the stock has already dropped 52% from its previous high. But don’t think it’s cheap..nope, at the current price it still has a P/E ratio of 65, so there’s room for more downside.
However, I see that it has reached a major support level, and volume is also increasing. I bought 40 shares at $280 (I also announced this in the private chat…hope you took this position along with me and you are in profit).
HELP: How to interpret the chart
All charts are daily timeframe.
The gray zone marks support and resistance.
The slim blue lines are trend lines
The moving averages used are 200 EMA, 50 EMA, 20 EMA, and 10 EMA.
The 200 EMA is the most important for trend direction.
The 10 EMA is used for exits, if you are in profit and the price closes below the 10 EMA on a daily close, exit the position.
Place your stop loss at -10%. For an A++ setup, you can extend it to -20%, but never let a position go beyond that.
Important: That 20% refers to your position size, not your total capital. You should never risk more than 3% of your total capital on any single trade.
Many of you wrote to me saying you’d like us to have a Discord server where we can connect. I heard you. and I’ve just created one.
All of you who are PRO, send me a direct message and I’ll give you a special role that unlocks a private channel where we can connect and share daily market opportunities.
If you have any questions, please write to me using the chat feature!
“One trade closer to freedom”
Vladislav