

High Probability Trades for Week 39, 2025
29 September - 3 October 2025 | Edition 9

This post is available exclusively to PRO members and contains my interpretation of the watchlist along with the trading opportunities I see for the next week.
To better understand the strategy we are following and not to buy blindly without any context, please read and analyze my strategy carefully:

All the positions I take can be found in the Freedom Trades private chat.
Inside My Portfolio
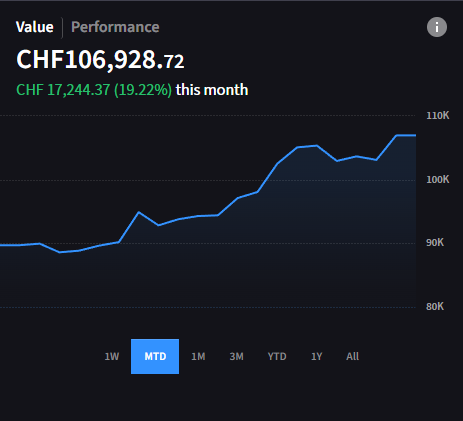
Because you pay for this newsletter monthly, I feel I have the responsibility and duty to be 100% transparent with you. That’s why I’ve introduced this format where I show you every week exactly what my portfolio looks like. (shares, total value of my portfolio, avg price - everything!)
Right now, these are my positions:
Attention: since I live in Switzerland, the currency is set in CHF (which means if you convert it to USD, the amount is much higher).
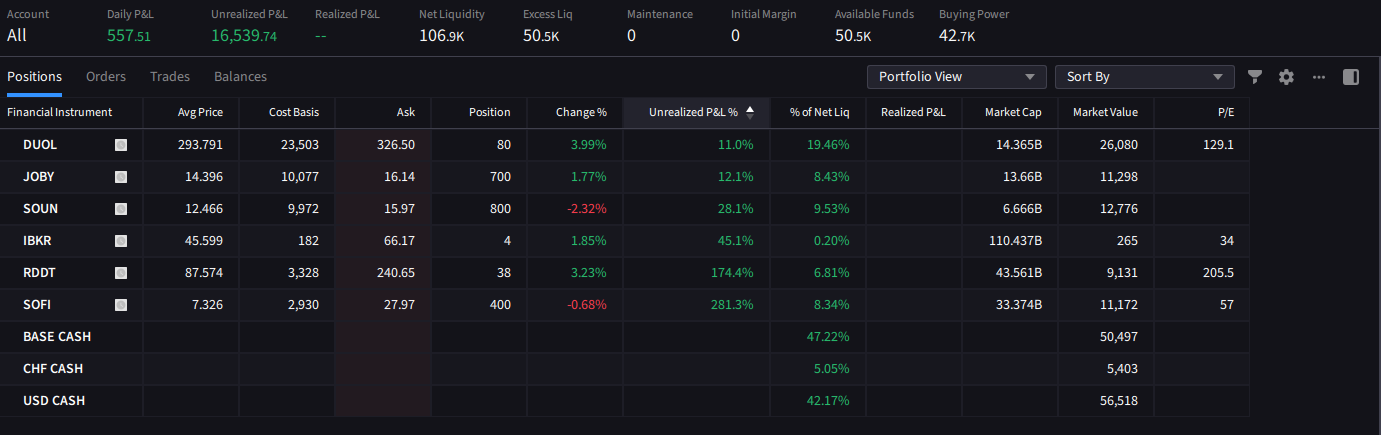
Disclaimer: I deposited 3500CHF this week.
This Week’s Opportunities!
Hello warriors!
I hope you survived this week!
Before we get started, I want to share that every week I’m looking for new ways to bring you even more value for the money you’re investing here.
I’m planning to build tools that will help with risk management, position sizing, and tracking every trade (either through a partnership or by creating a custom Excel sheet).
A year from now, the value of this community will be ten times greater. But I can only make that happen with your help!
This week, I’ve created a survey that I’d really like you to complete. I take your feedback very seriously, and filling it out will directly help shape the future of this community.
You’ll find the link below (it takes no more than 3 minutes to complete).
Next week we’re heading into October, and I came across an interesting study that says this: “ Since World War II, there have been 31 prior periods where the S&P 500 posted positive returns for five or more straight months, but there have only been nine of those when every positive month was a gain of at least 1%, said analysts at Bespoke.”
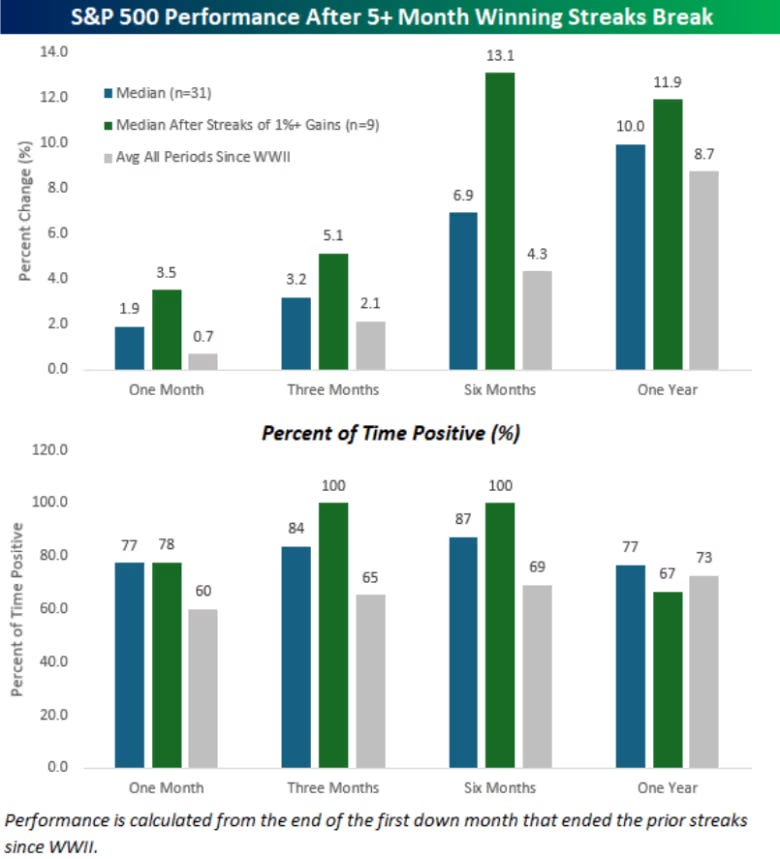
Although in the long term we still expect this year to remain a strong one, in the short term the likelihood of a pullback is increasing.
Keep in mind that all the opportunities I’ll list below will have a much higher probability of playing out if the S&P 500 moves in the same direction.
Don’t forget that most of the trades we take are high beta momentum stocks, which means we’re directly exposed to how the broader market performs.
Stay vigilant, and let’s connect on the Discord server or in the private chat ( I’m always there.)
Ticker: RUN
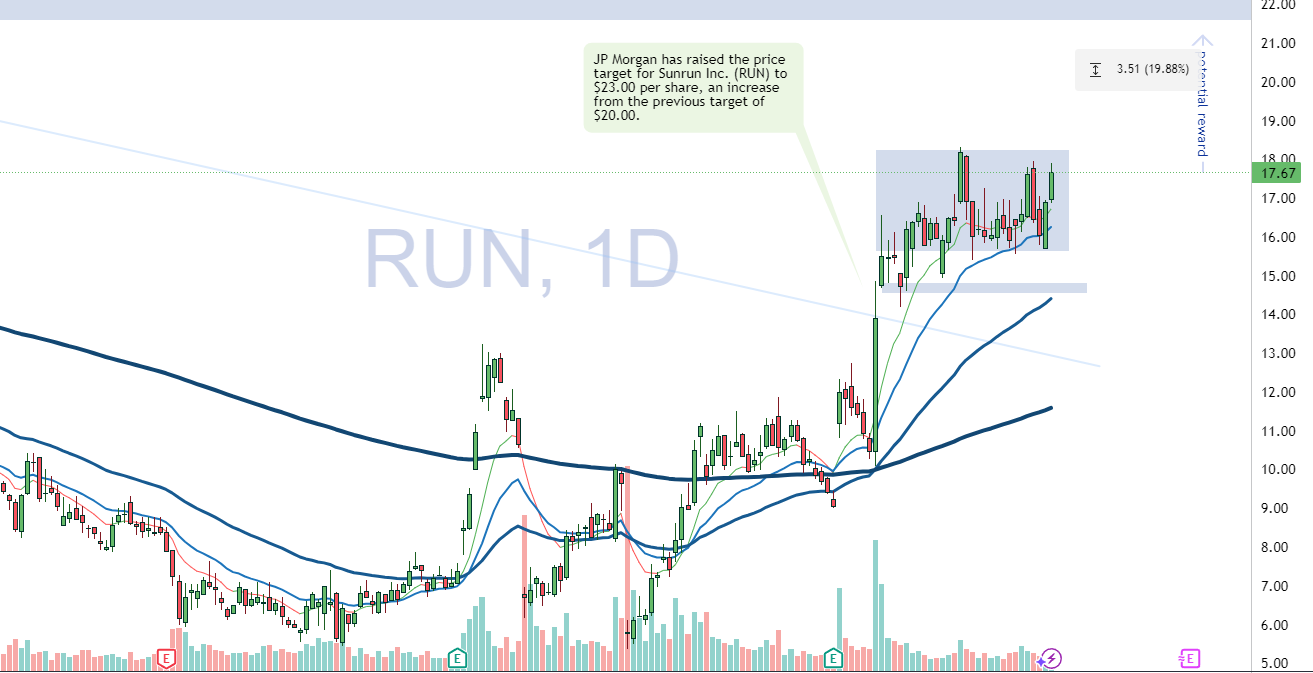
It looks like RUN managed once again this week to hold the $15–17 level.
I believe it still has the potential to retest the $21 zone, especially since, in a week where most high beta stocks sold off, RUN showed strength and managed to maintain its level.
RUN broke out of the falling wedge pattern on the weekly chart that it has been in since 2022 and seems to have found an accumulation zone, setting up for another breakout leg after JP Morgan raised its price target to $23.00 per share, up from the previous $20.00.
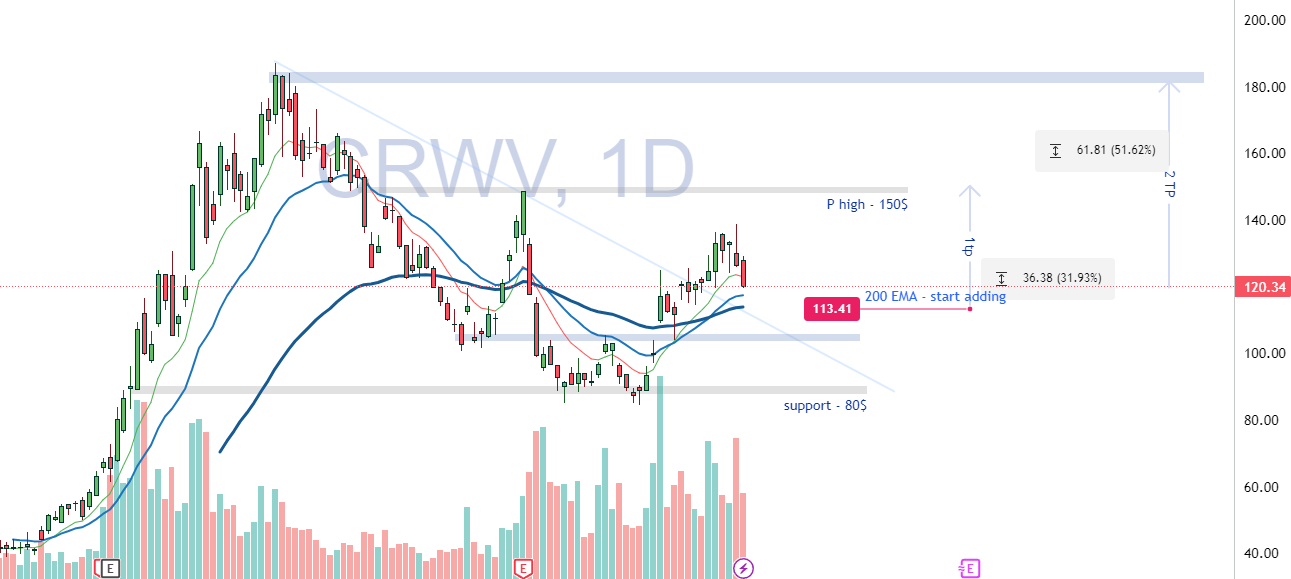
The structure looks like a bullish flag continuation pattern that is currently retesting support. The stock broke out from a downtrend channel (you can see the diagonal resistance line). Now it is consolidating and pulling back into EMAs. If support holds (especially above the 200 EMA at ~113), it can continue higher toward resistance (~150).
If price loses the 200 EMA and breaks below ~$110, it could instead turn into a failed breakout, so be careful with your risk here.
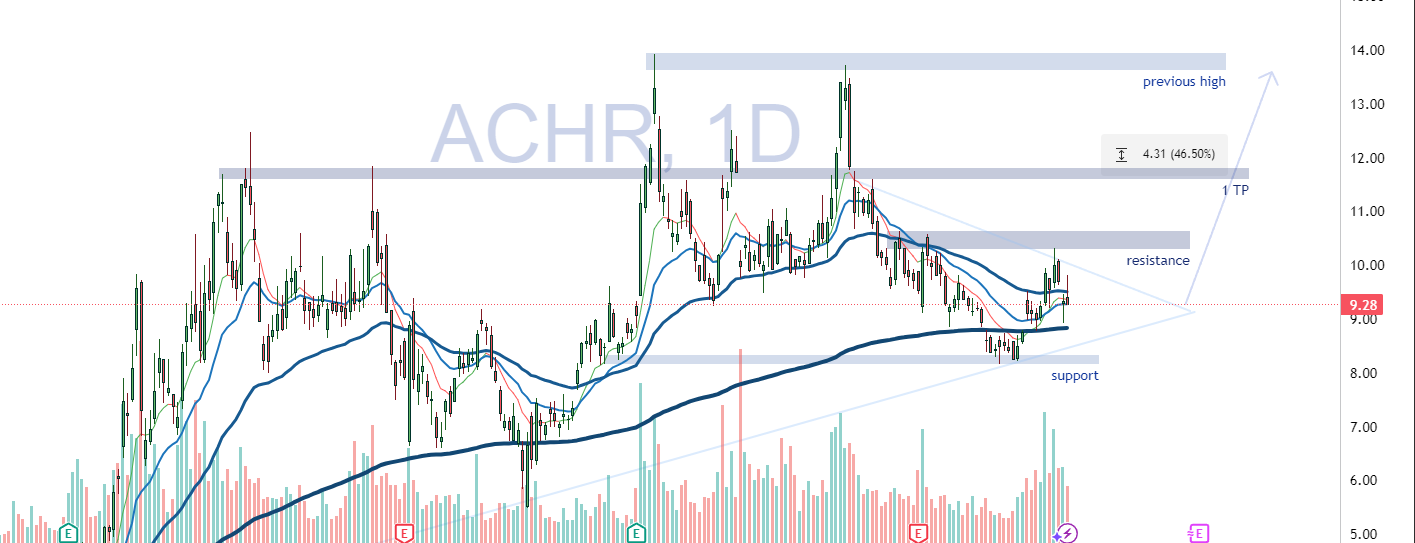
On the daily chart for ACHR, the stock is trading around $9.28 after bouncing from the strong support zone near $8. That level has held well in the past and once again acted as a floor for buyers to step in.
Right now, price is running into a resistance area around $9–10, which has been a tough spot before. Just above that sits the first real target at $11, and if momentum continues, there’s room for a move back toward the previous highs around $13–14.
What makes this bounce interesting is that it happened right above the 200 EMA, a major trend indicator that’s now acting as support. The shorter-term moving averages are also starting to curl up, suggesting that momentum could be shifting back to the upside. Volume has picked up on the green days, which shows some accumulation, although it hasn’t exploded yet.
If the stock manages to break and hold above that $10 resistance level, it opens the door for higher targets. On the flip side, if it fails here and slips back under $8, the bullish case would be off the table and we’d likely see more downside.
Ticker: DUOL
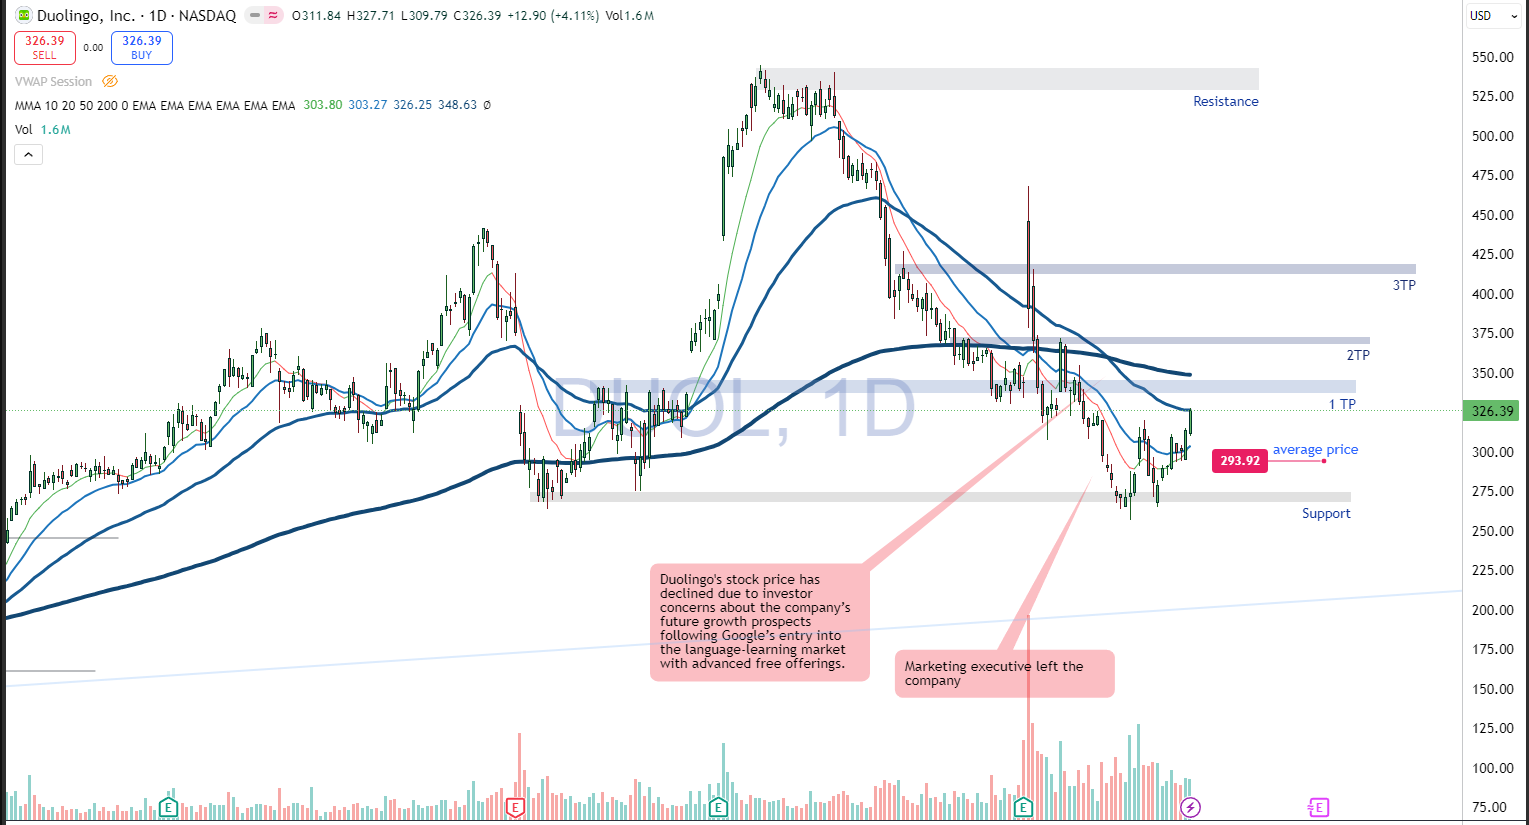
I’m still in Duolingo, and I believe there’s more room for growth. First, it will likely retest the $340 level, where the 200MA aligns with the previous high. If it manages to break through this level, the next target zone would be $360–370.
A lot will also depend on how the S&P 500 performs over the next month, and the probability of seeing another green month is relatively low (so be cautious!)
TICKER: GPRE
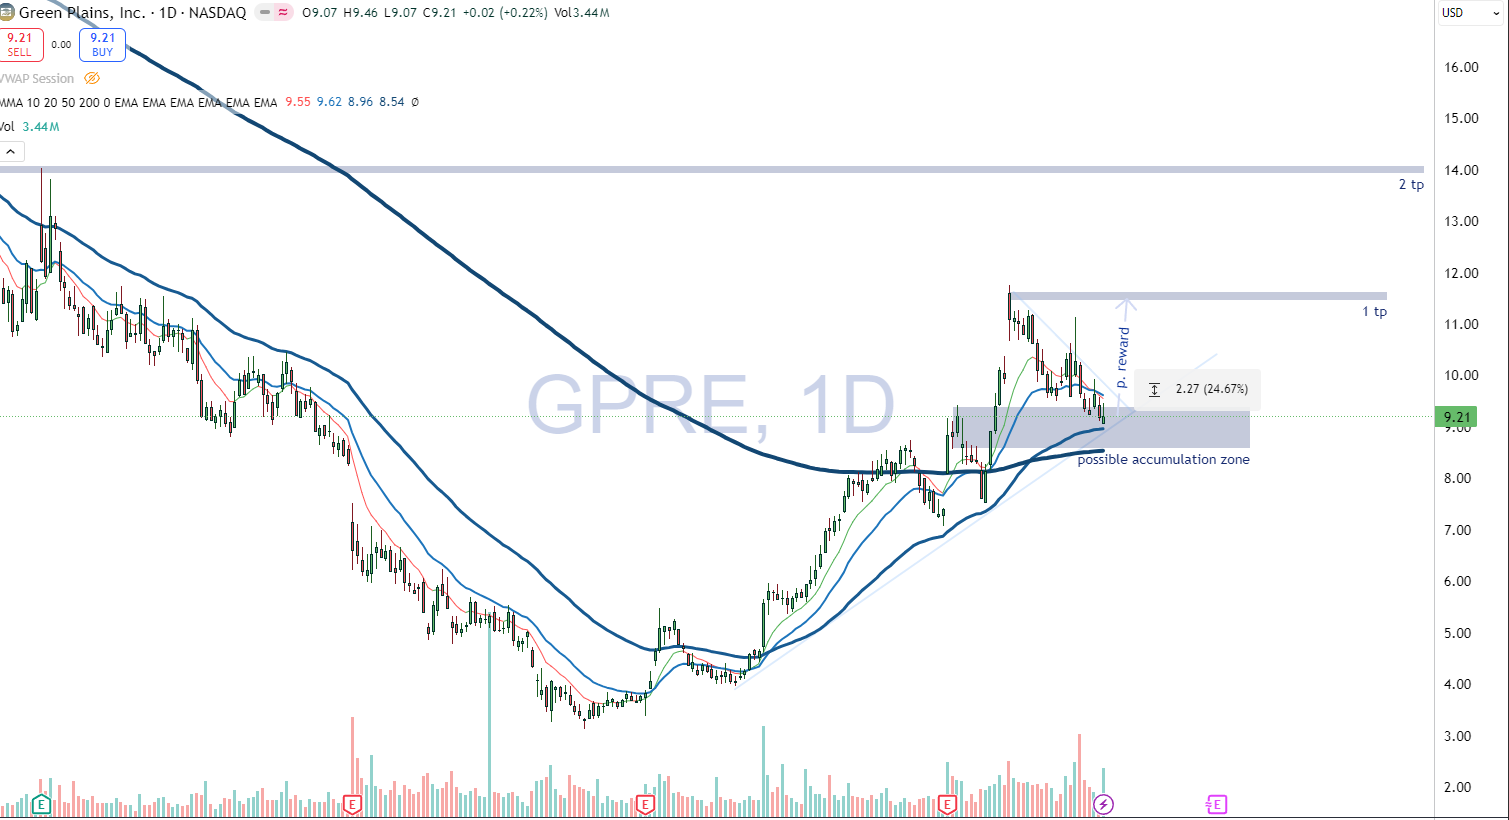
If it manages to hold the trendline formed since June 2025, it should bounce back toward the previous high, with a potential reward of around 24%. Pay close attention to how it reacts if it breaks that trendline to the downside, watch the volume closely and see if there’s heavy buying around the $8.50 area.
The market cap is only $600M, which makes it a small-cap stock and therefore extremely volatile. Be careful how you set your stop loss.
HELP: How to interpret the chart
All charts are daily or weekly timeframe. (check the watermark)
The gray/blue zone marks support and resistance.
The slim blue lines are trend lines
The moving averages used are 200 EMA, 50 EMA, 20 EMA, and 10 EMA.
The 200 EMA is the most important for trend direction.
The 10 EMA is used for exits, if you are in profit and the price closes below the 10 EMA on a daily close, exit the position. (wait for EOD before closing)
Place your stop loss at -10%. For an A++ setup, you can extend it to -20%, but never let a position go beyond that.
Important: That 20% refers to your position size, not your total capital. You should never risk more than 3% of your total capital on any single trade.
Many of you wrote to me saying you’d like us to have a Discord server where we can connect. I heard you. and I’ve just created one.
All of you who are PRO, send me a direct message and I’ll give you a special role that unlocks a private channel where we can connect and share daily market opportunities.
“One trade closer to freedom”
Vladislav