


Dear Traders,
You have seen this happen.
A stock doubles in two months.
You see it on your scanner, you see it on X, everyone is talking about it.
And you tell yourself: “Too late. I missed it.”
Then it moves sideways for three or four weeks.
Then it breaks out and doubles again.
Without you.
Today I want to make sure that never happens to you again.
The pattern is called the High Tight Flag.
William O’Neil called it “the strongest of patterns, but it’s also very risky and difficult to interpret correctly.”
Both parts of that sentence are true.
So today you get both: the rules, and real example charts.
What Is a High Tight Flag?
A High Tight Flag is a stock that doubles in a few weeks, then rests near its highs for a few weeks, then breaks out to new highs.
It has three parts:
The pole: the explosive move up.
The flag: the short, shallow pause near the top.
The breakout: price clears the top of the pole on big volume.
That’s it.
Simple to describe.
Hard to find, because very few stocks ever double in eight weeks.
Why It Works
Think about who is in the stock during the flag.
The people who bought before the move are sitting on 100% gains. Many of them sell. That selling is what creates the flag.
The people who are late are scared to buy something that just doubled. So they wait.
If the stock only gives back 10-25% while all that profit-taking happens, it tells you something important:
Someone big is absorbing the supply.
Weak hands sell to strong hands.
When the selling dries up, there is nobody left to sell, and the stock can move fast.
Mark Minervini calls this setup the “Power Play” and puts it this way: these setups “can move up fast in the shortest time, and often they signal a dramatic shift in the prospects of a company.”
The Rules of a High Tight Flag Setup
Here are the classic criteria. They come from two sources: William O’Neil (How to Make Money in Stocks) and Mark Minervini (Trade Like a Stock Market Wizard, where he calls it the Power Play).
1. The pole: +100% in 8 weeks or less.
O’Neil: 100% to 120% in four to eight weeks. Minervini: 100% or more within eight weeks, on huge volume.
2. The flag: 3 to 5 weeks.
O’Neil says three to five weeks. Minervini says three to six, and adds that some “can emerge after only 10 or 12 days.”
3. The depth: no more than 20-25%.
Measured from the top of the pole to the lowest point of the flag. Minervini allows 25% only for some lower-priced stocks.
4. Volume in the flag: lighter than in the pole.
Both describe volume drying up during the pause. (More on this below, because my data surprised me.)
5. The breakout: on at least 1.4x average volume.
O’Neil wants breakout volume at least 40% above average. Big money leaves footprints.
If one of these is missing, you don’t have a High Tight Flag.
It may still be a good trade. Just don’t expect this setup’s results from it.
How to Trade a High Tight Flag
Entry:
Buy when price trades above the top of the pole (the pivot).
O’Neil adds 10 cents to the highest point of the pattern.
If the stock gaps above the pivot at the open, your entry is the open.
Stop:
Below the low of the breakout day.
If the stop is wider than you are comfortable with, make the position smaller. Never move the stop.
Selling:
These stocks are already extended. They move fast in both directions.
So use the same rules I use on every trade: sell 1/3 into strength in the first days, then trail the rest with the 10-day moving average (or the 20-day once you are up 30% or more).
Real Examples of high tight flags
Many of you learn better visually, so here are some real examples of a high tight flag.
I also want to show you that, in reality, these setups are often not textbook examples, and I intentionally chose some that weren’t cherry-picked.
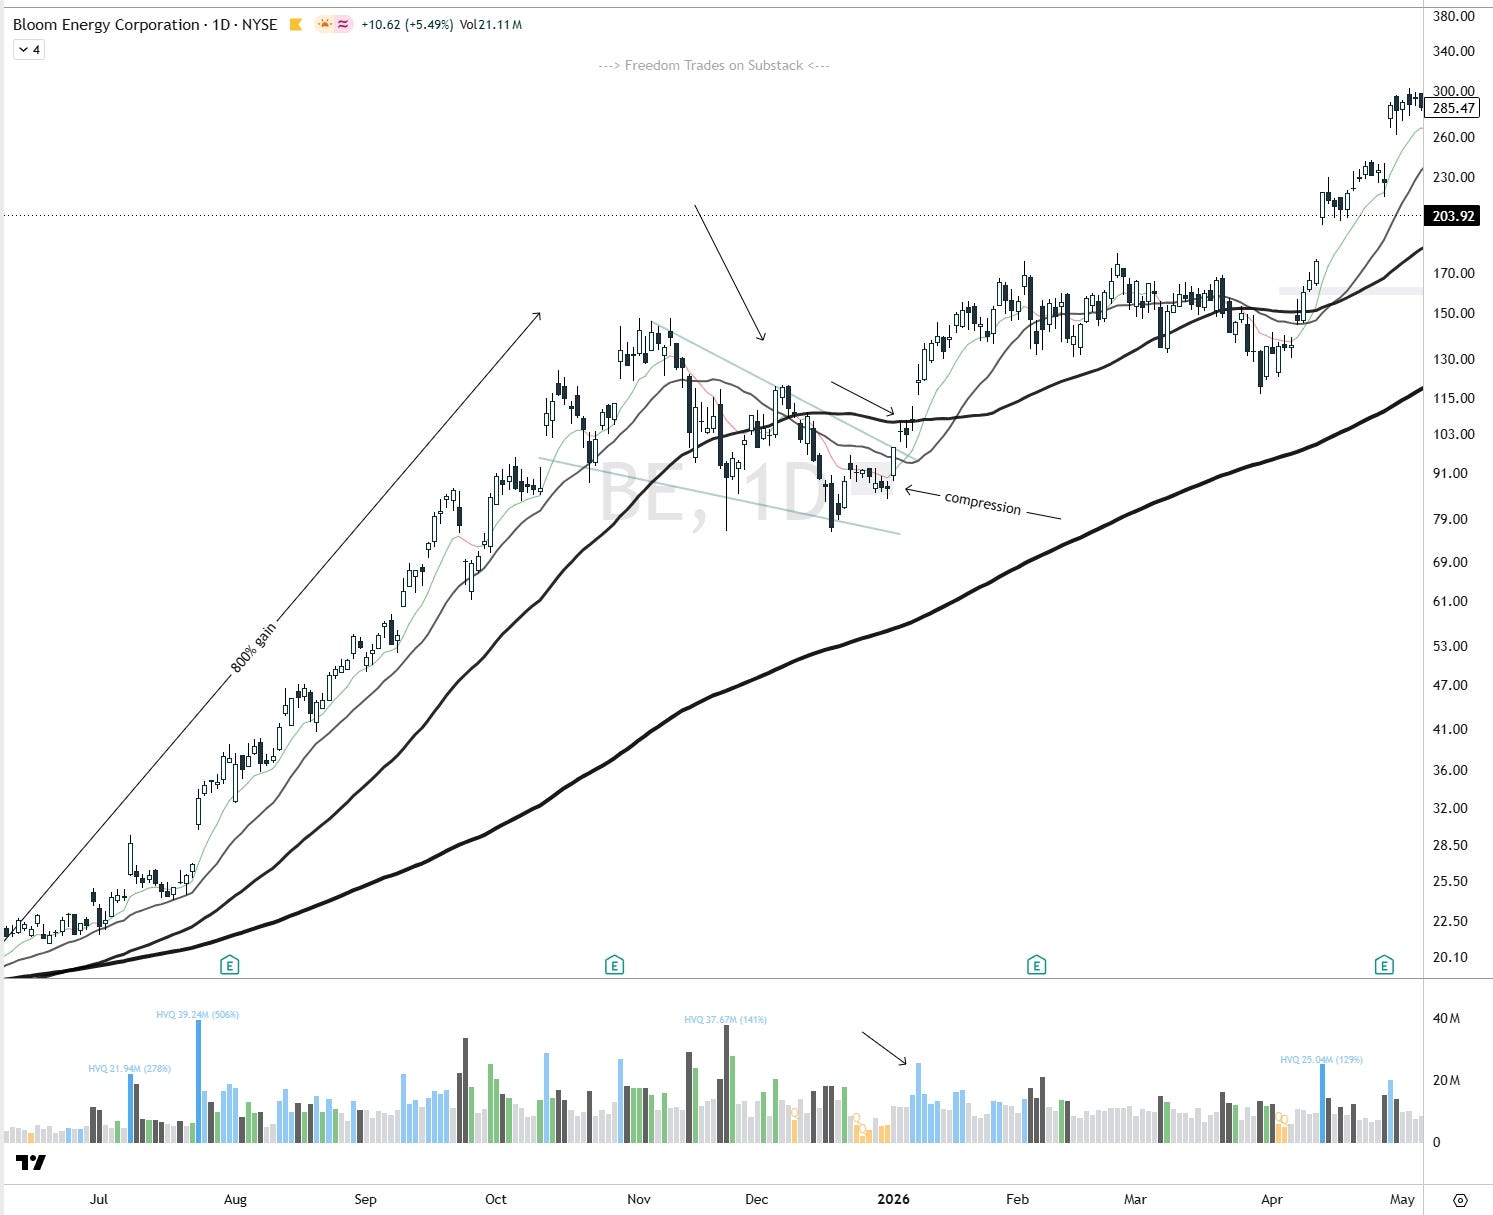
Look at the pole first. BE ran from $20.93 in June 2025 to $147.86 on November 10.
Then the pullback. It was deep: about -49%, down to $75.70 on December 17. That’s well past the 20-25% rule, so treat this one as a looser version of the pattern.
What matters is what came next. In the last two weeks of December, price tightened between about $84 and $96, and volume dried up to well under half of its average. That’s the compression on the chart.
On January 2, 2026, BE broke out of that compression, and on January 8 it moved on 1.8x average volume. A stop under the compression low ($84.14) was about 15% away, so size it smaller.
If you waited for the classic pivot, BE cleared the pole high on January 16. The breakout-day low ($141.01) was undercut a week later, and then the stock closed back above the pivot on January 28. That’s why you need a re-entry plan.
By May 14, 2026, BE hit $310, more than double the pivot.
Join 2,000+ traders
For less than $0.80/day, unlock a proven swing trading strategy, real-time trade alerts, and access to a private Discord community.
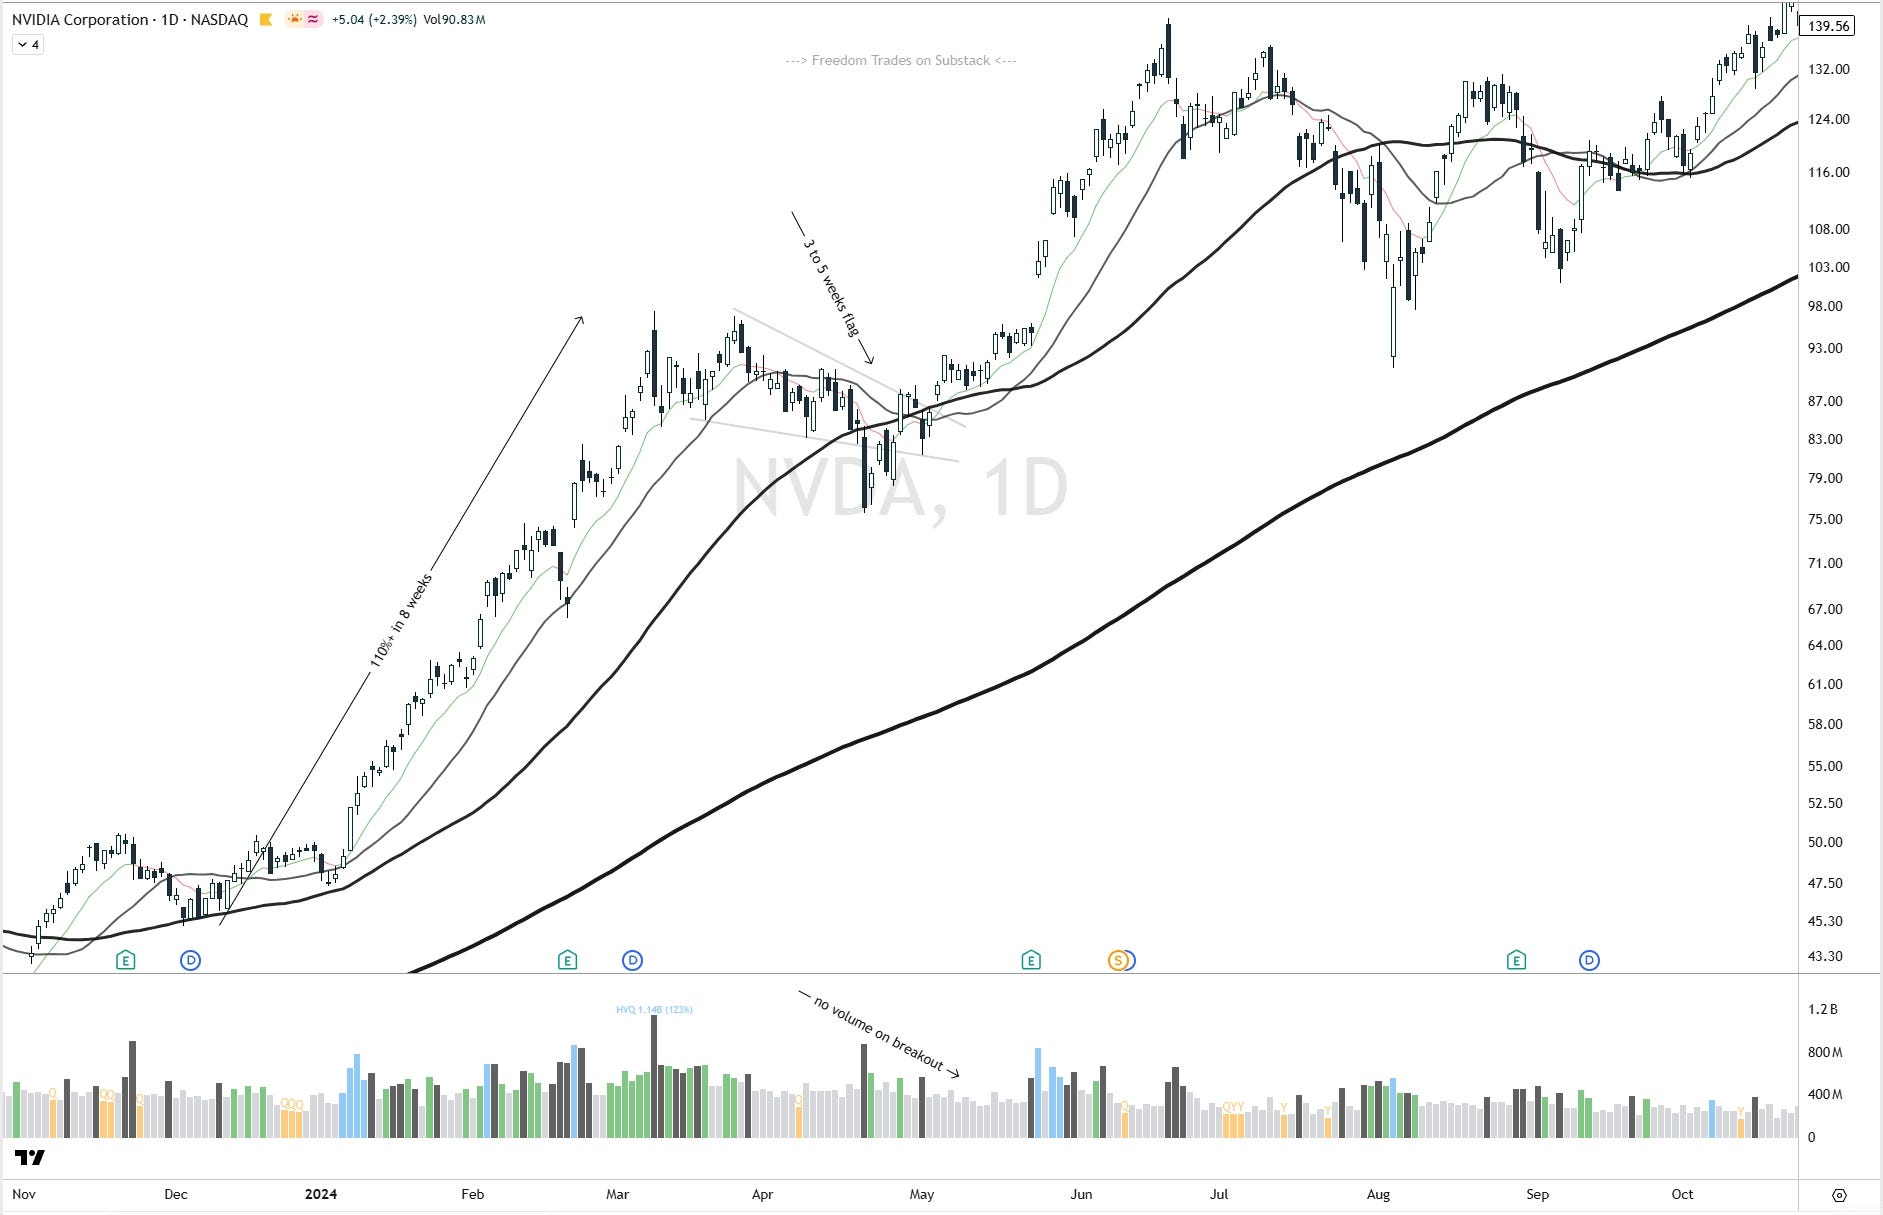
NVDA went from $47.32 on January 3, 2024 to $97.40 on March 8. That’s about +106% in nine weeks.
Then it rested. The flag pulled back 22%, to $75.61 on April 19, inside the 20-25% limit. Through most of April, volume ran at about 0.5-0.9x of its 50-day average. Sellers were drying up.
In early May, price broke the flag’s down trendline on light volume. That’s the “no volume on breakout” note on the chart.
The real pivot came on May 23. NVDA gapped above $97.40 after earnings, opened at $102.03 and traded 1.8x its average volume. The breakout-day low was $101.52.
Four weeks later, on June 20, it hit $140.76, +38% from the entry.
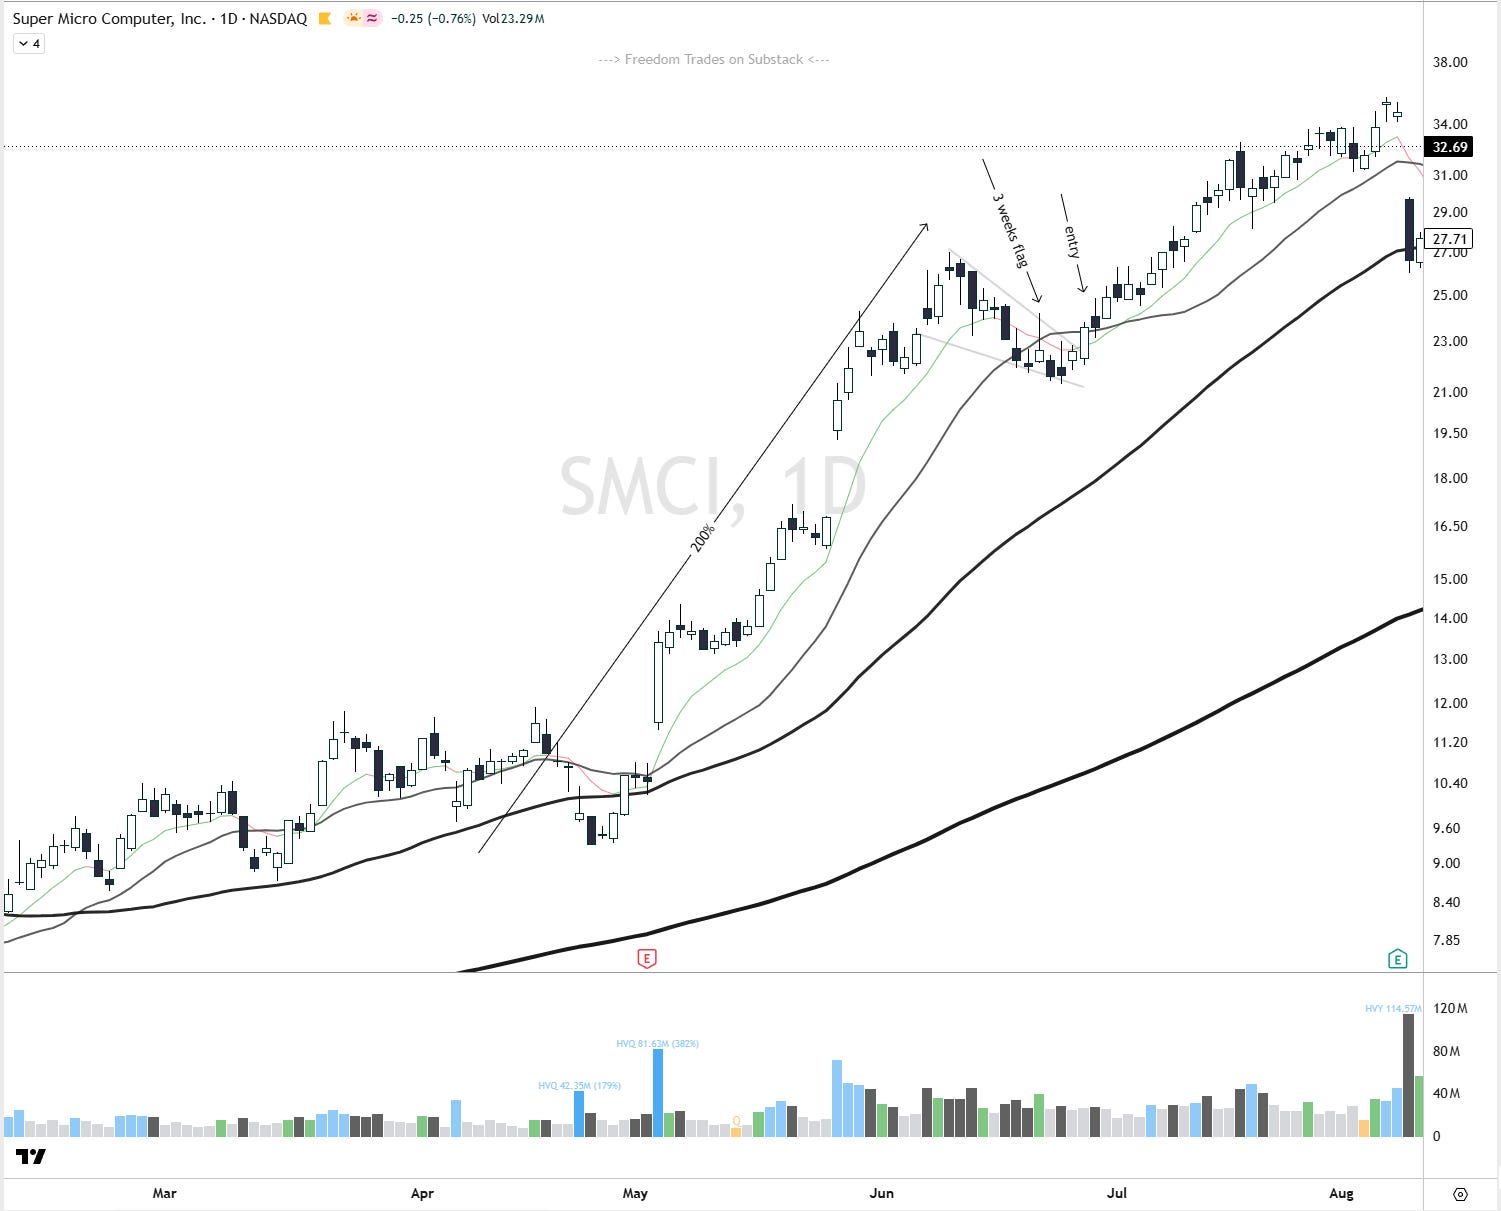
SMCI went from $9.32 on April 25 to $27.02 on June 9, 2023. That’s about +190% in six and a half weeks, with volume spikes of 2-5x average along the way.
The flag lasted about three weeks and pulled back 21%, to $21.31 on June 26. Volume didn’t fully dry up (about 0.9-1.9x of average), but it was much lighter than the 2-5x days of the pole.
The entry on the chart is the break of the flag’s trendline at the end of June, around $23.60-24.90.
If you waited for the pole high, SMCI opened above $27.02 on July 11, at $27.52. The breakout-day low was $26.25
It ran to $35.70 on August 7.
More examples:
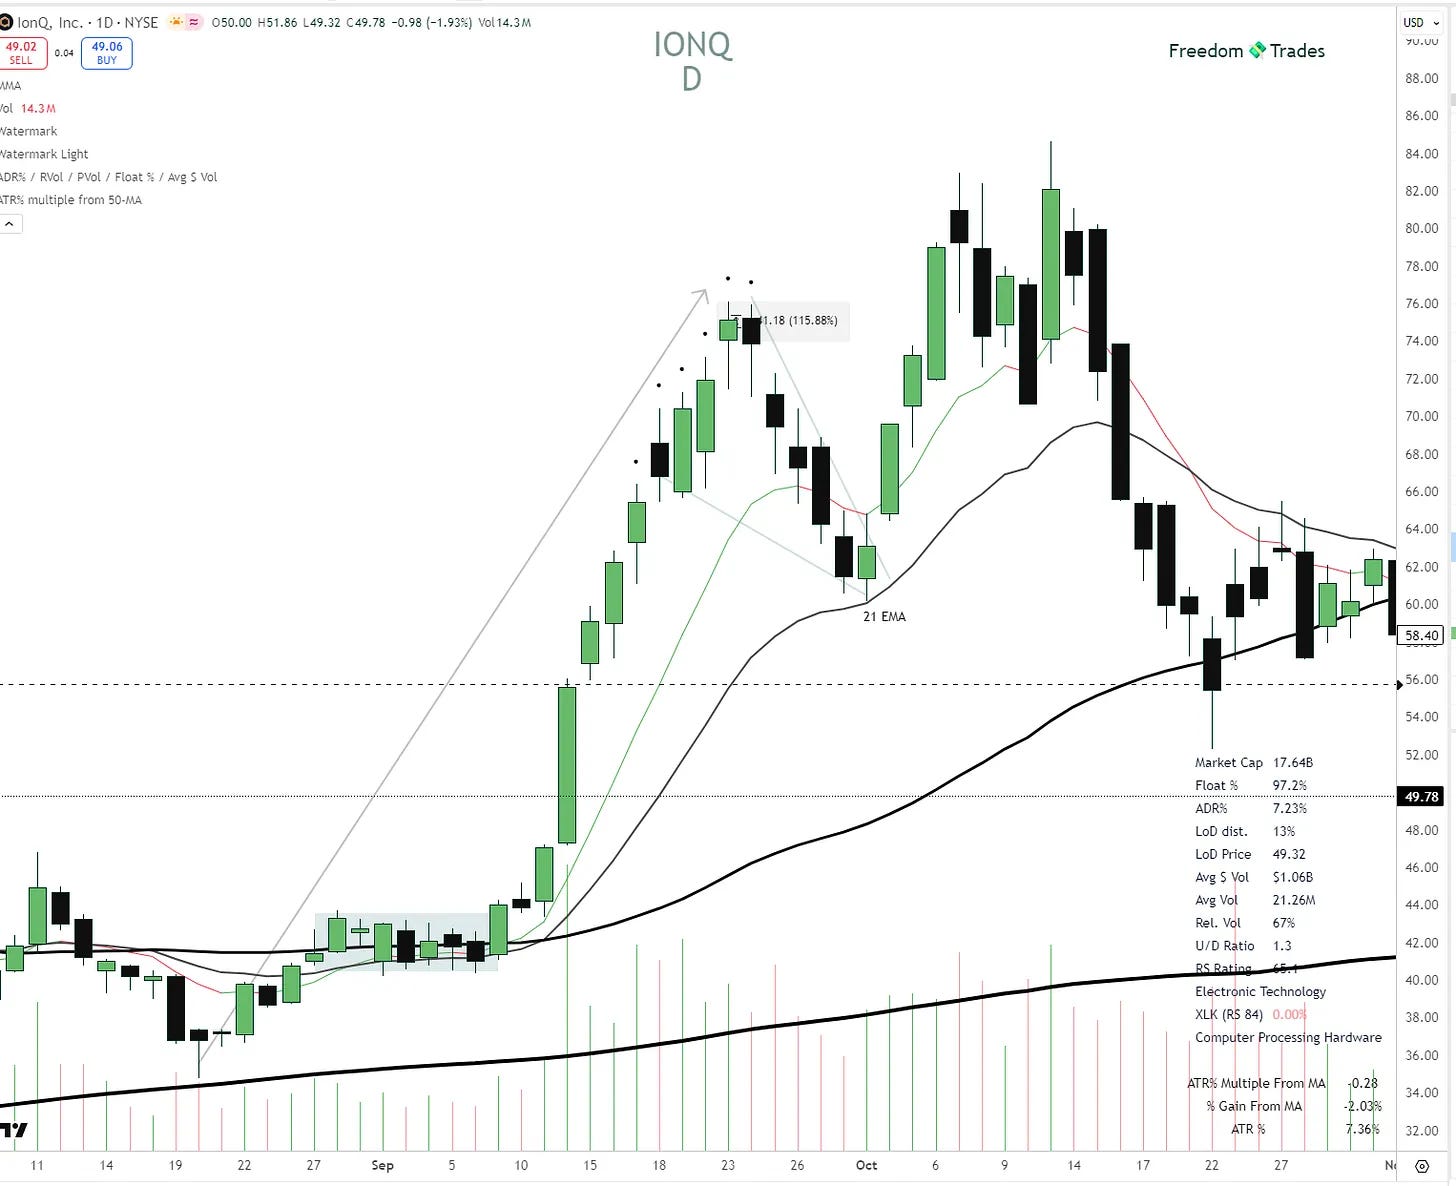
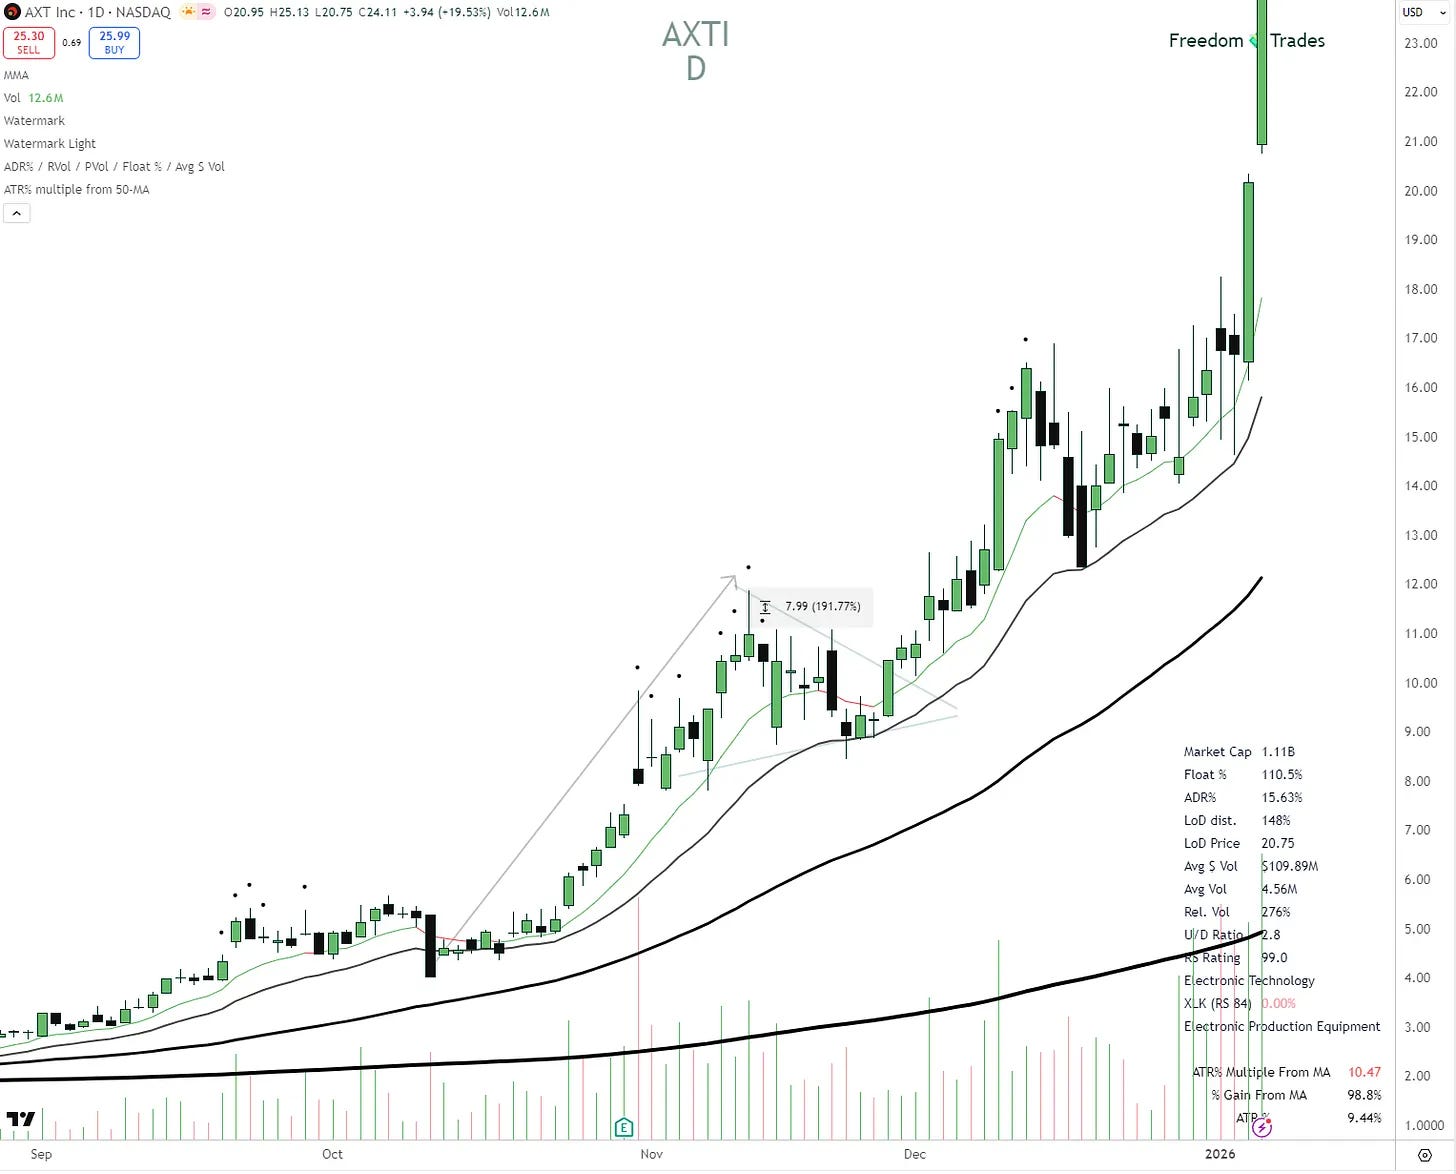
Example of a failed High Tight Flag
Not everything is perfect.
O’Neil himself warned that this pattern is risky. Here is an example
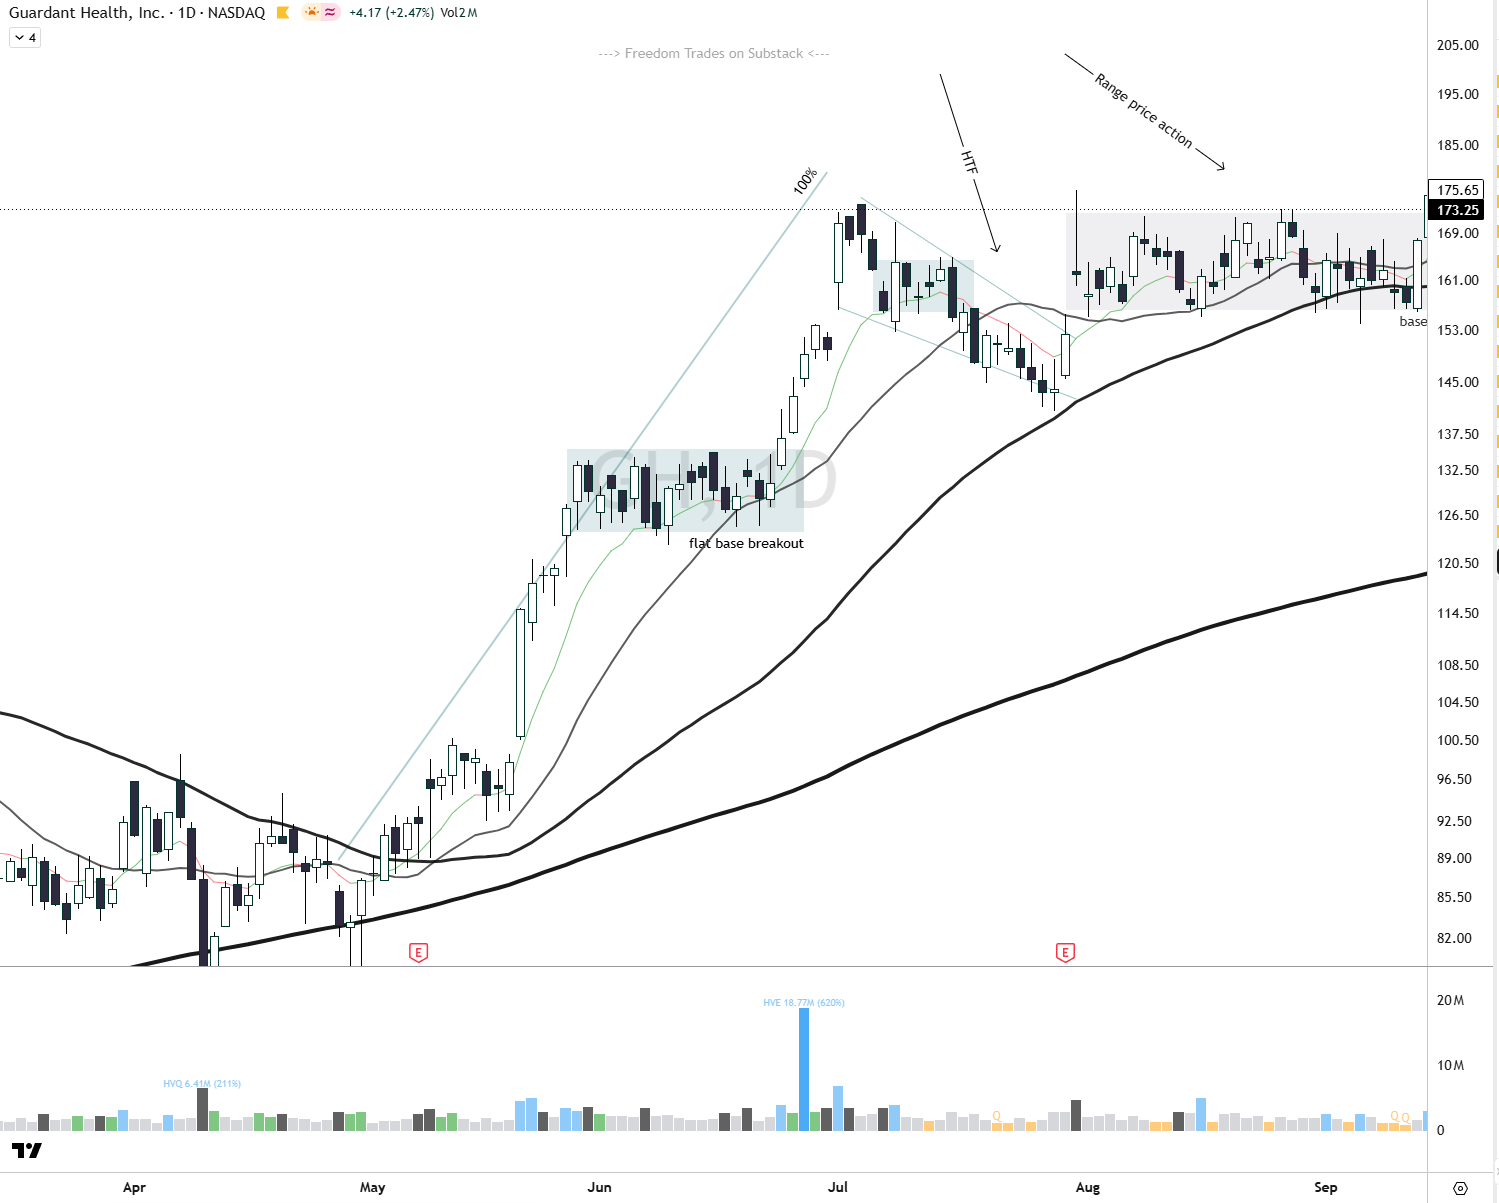
GH ran from $79.01 on April 30 to $174.08 on July 6. That’s about +120% in a little over nine weeks, with a flat base breakout in June on the way (the June 26 volume spike, 18.8M shares, was about 8x average).
The flag looked right. About three weeks, a 19% pullback to $140.86 on July 29, and volume drying up to 0.4-0.6x of average.
Then came earnings. On July 31, GH gapped up to $162.50, traded as high as $176.58, above the $174.08 pivot, and closed at $161.99, back below it.
With the classic entry at $174.18 and a stop under the breakout-day low ($160.01), you were stopped out the next day, about 8% lower.
After that, GH went sideways between about $154 and $173 for six weeks. That’s the range on the chart. It only cleared $176.58 on September 15.
How to Find High Tight Flags
You won’t find many. That’s normal.
I scanned about 130 momentum stocks from mid-2018 to October 2026 with a loose version of the rules (pole of 90%+ in 8 weeks, flag of 2-6 weeks, no deeper than 25%).
I found 85 moves in 8 years. Only 39 of them had a 100%+ pole and a breakout on 1.4x+ volume.
And they cluster in strong markets: 28 of the 85 came in 2020 alone, and 41 in 2024-2026.
Here’s what to scan for:
Performance: up 90-100% or more from the lowest low of the last 40 trading days.
Distance from the high: price is within 25% of that recent high.
Time: the high was set 2 to 6 weeks ago.
Liquidity: enough dollar volume that you can get in and out. (at least $100M daily avg volume)
Market: the general market in an uptrend (SPY above its 10- and 20-day moving averages is the simplest check).
The High Tight Flag Checklist
Save this.
☐ Stock up 100%+ in 8 weeks or less
☐ Flag of 3-5 weeks (some strong ones resolve in 2)
☐ Flag no deeper than 30% from the top
☐ Breakout above the pole high on 1.4x+ average volume
☐ General market in an uptrend
☐ Stop below the breakout-day low, position sized for a gap
☐ Re-entry plan if the first stop gets tested
☐ Selling plan ready before you buy
High Tight Flags are rare.
When one shows up, you need to be watching it before the breakout, with your pivot, stop and size already planned.
That’s exactly what we do inside Freedom Trades PRO.
Every week I share the high-probability setups I’m watching, the scanner results, the market context, and real-time alerts when I enter and exit.
And you get the private Discord, with traders who follow the same process.
If you want to stop finding these stocks after they already doubled again, come trade them with us.
And if you’ve been thinking about joining our community, now is the moment.
Right now, the yearly plan is 49% off.
See you inside :)
Trade Setups of The Week
High Probability Trades for 26-30 October 2026

The vast majority of tickers are at the key levels I mentioned in the previous edition of High Probability Trades.
If you think this newsletter could help your friends, share it with them so it can reach as many traders as possible.
And here’s the fun part: when you share it, you can unlock special rewards + you will look smart in front of your friends :)
“One trade closer to freedom.”
Vladislav