


Today you learn how to sell into strength, not fear.
You will know exactly when to cut part of your position.
And how to let the rest run with your profit protected.
I tested this across hundreds of trades, not a few pretty charts.
The Freedom Trades community already uses this system every day.
First, I show you what “trim into strength” really means.
Then I give you the exact rules to trail the rest of your position.
Last, you get a real example, step by step.
What does “trim into strength” really mean?
Trim into strength means scaling out of a position while price is still strong, so you secure some gains, reduce exposure, and still keep part of the trade alive in case the trend continues.
The goal is to lock in some profit and lower risk without fully exiting a trade that still has room to run.
Why do we do this?
Because if you don’t sell into strength, you will be forced to sell into weakness.
To know exactly when to sell, we first need to define what strength actually means.
How do we define strength in a stock?
My definition of strength is:
when the stock is above the key moving averages (20, 50, and 200MA)
when the stock is extended from the 50MA
First of all, the condition that price is above the key moving averages is very straightforward and leaves no room for discretion.
The Price is either above them or it is not.
Now let me explain the second point, namely: “when that stock is extended from the 50MA.”
We also need to make this quantifiable, because in our selling rules there should be no room for discretion, as this will affect your decision‑making and ultimately your trading account.
The way I calculate this is by taking the Average True Range percentage (ATR%) of each stock and the percentage gain of the price from the 50MA, and then dividing the latter by the ATR%.
The formula is :
A = ATR% = $ ATR / $ Last Done Price
B = % Gain From 50-MA
B / A = ATR% multiple from 50-MA
But you don’t have to do all of this manually.
There is an indicator that can do it for you, created and shared by Jfsrev (the one who popularized this thesis), and the best part is that it’s free.
You can download it here: https://www.tradingview.com/script/oimVgV7e-ATR-multiple-from-50-MA/
And in real time, the indicator looks something like this on the chart.
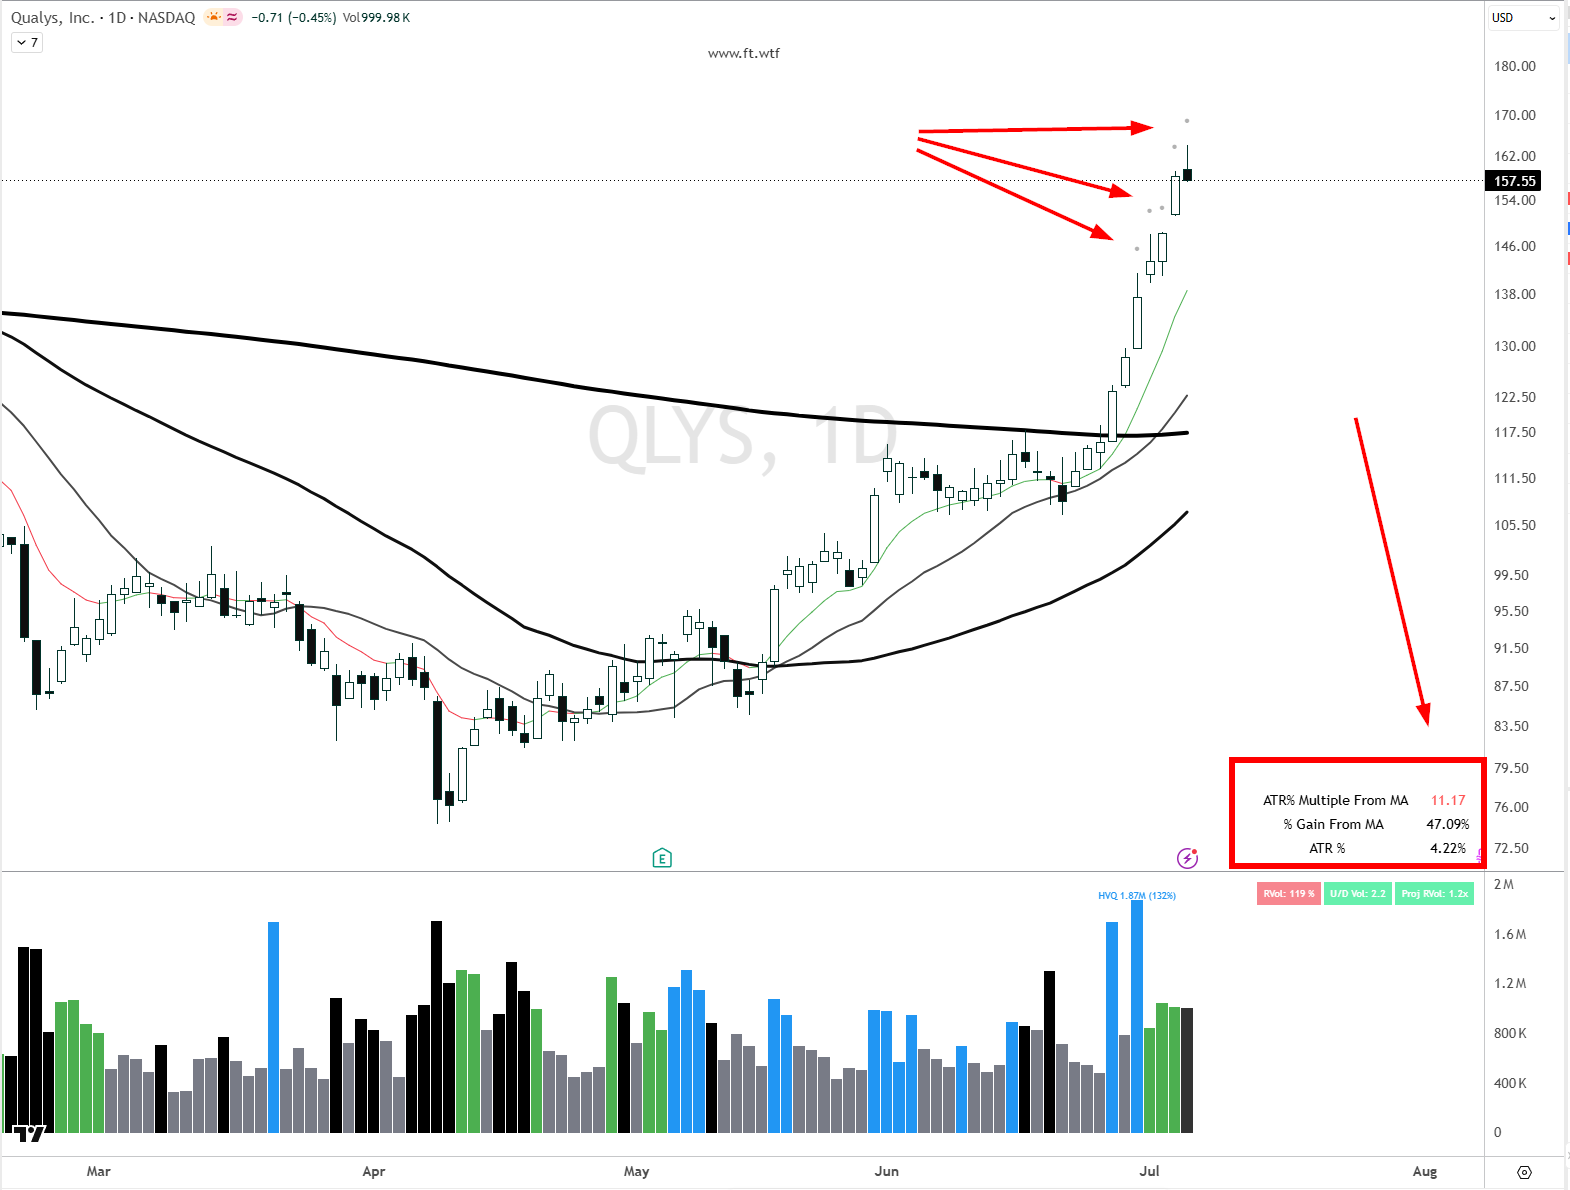
In this example, QLYS is extended 11 ATR% multiples from the moving average.
As you can see, its average ATR% is 4.22%, and if you divide the percentage gain from the moving average, which is 47.09%, by 4.22%, you get 11.17 as its ATR% multiple.
Those small black dots above the candles on the chart are printed once the stock exceeds 7 ATR% multiples from the 50MA.
Why above 7? Because, according to backtesting, that is the point at which most stocks tend to experience a pullback.
I will talk more about this backtest and share it with you in a future edition.
So, to summarise before we move to the next part:
We define a stock as being in strength when:
it is above the key moving averages (20MA, 50MA, and 200MA), and
it is above 7 ATR% multiples from the 50MA.
How to Sell a Stock into Strength – Trade System
Now I’ll share with you the exact system we already use in the Freedom Trades community to protect our profits.
And I’ll walk you through how I personally manage a trade depending on which day I’m in the position.
Let’s say I’ve just initiated a new swing trading position.
Day 0 to 4
In the first few days, I start taking 1/3 once the trade reaches more than 3R (R is a unit of risk).
I also take off the first one-third if the move reaches three times the ADR% measured from my entry, because at that point the stock has already delivered a meaningful expansion and I want to pay myself early.
So at least one of these conditions has to be met for me to sell the first third of the position.
By doing this, I eliminate the initial risk I have in the trade and, essentially, the trade becomes risk‑free – meaning that if my stop loss gets hit, I will not have any loss, because I already sold one third.
The goal here is to offset the initial risk.
After Day 5
Once the trade gets past day five, I become more systematic with the exit and sell 10% of the position at each higher multiple when ATR% stretches above the 7x multiple versus its 50MA reference.
After that, I trail the rest using the 10MA as my main stop, and if the stock closes below it at the end of the day, I can close the remaining position.
If momentum is still very strong and I am already sitting on at least a 30% unrealized gain, I can give the trade more room and use the 20MA instead.
I’ve even made a visual for you so it’s easier to understand the tactic.
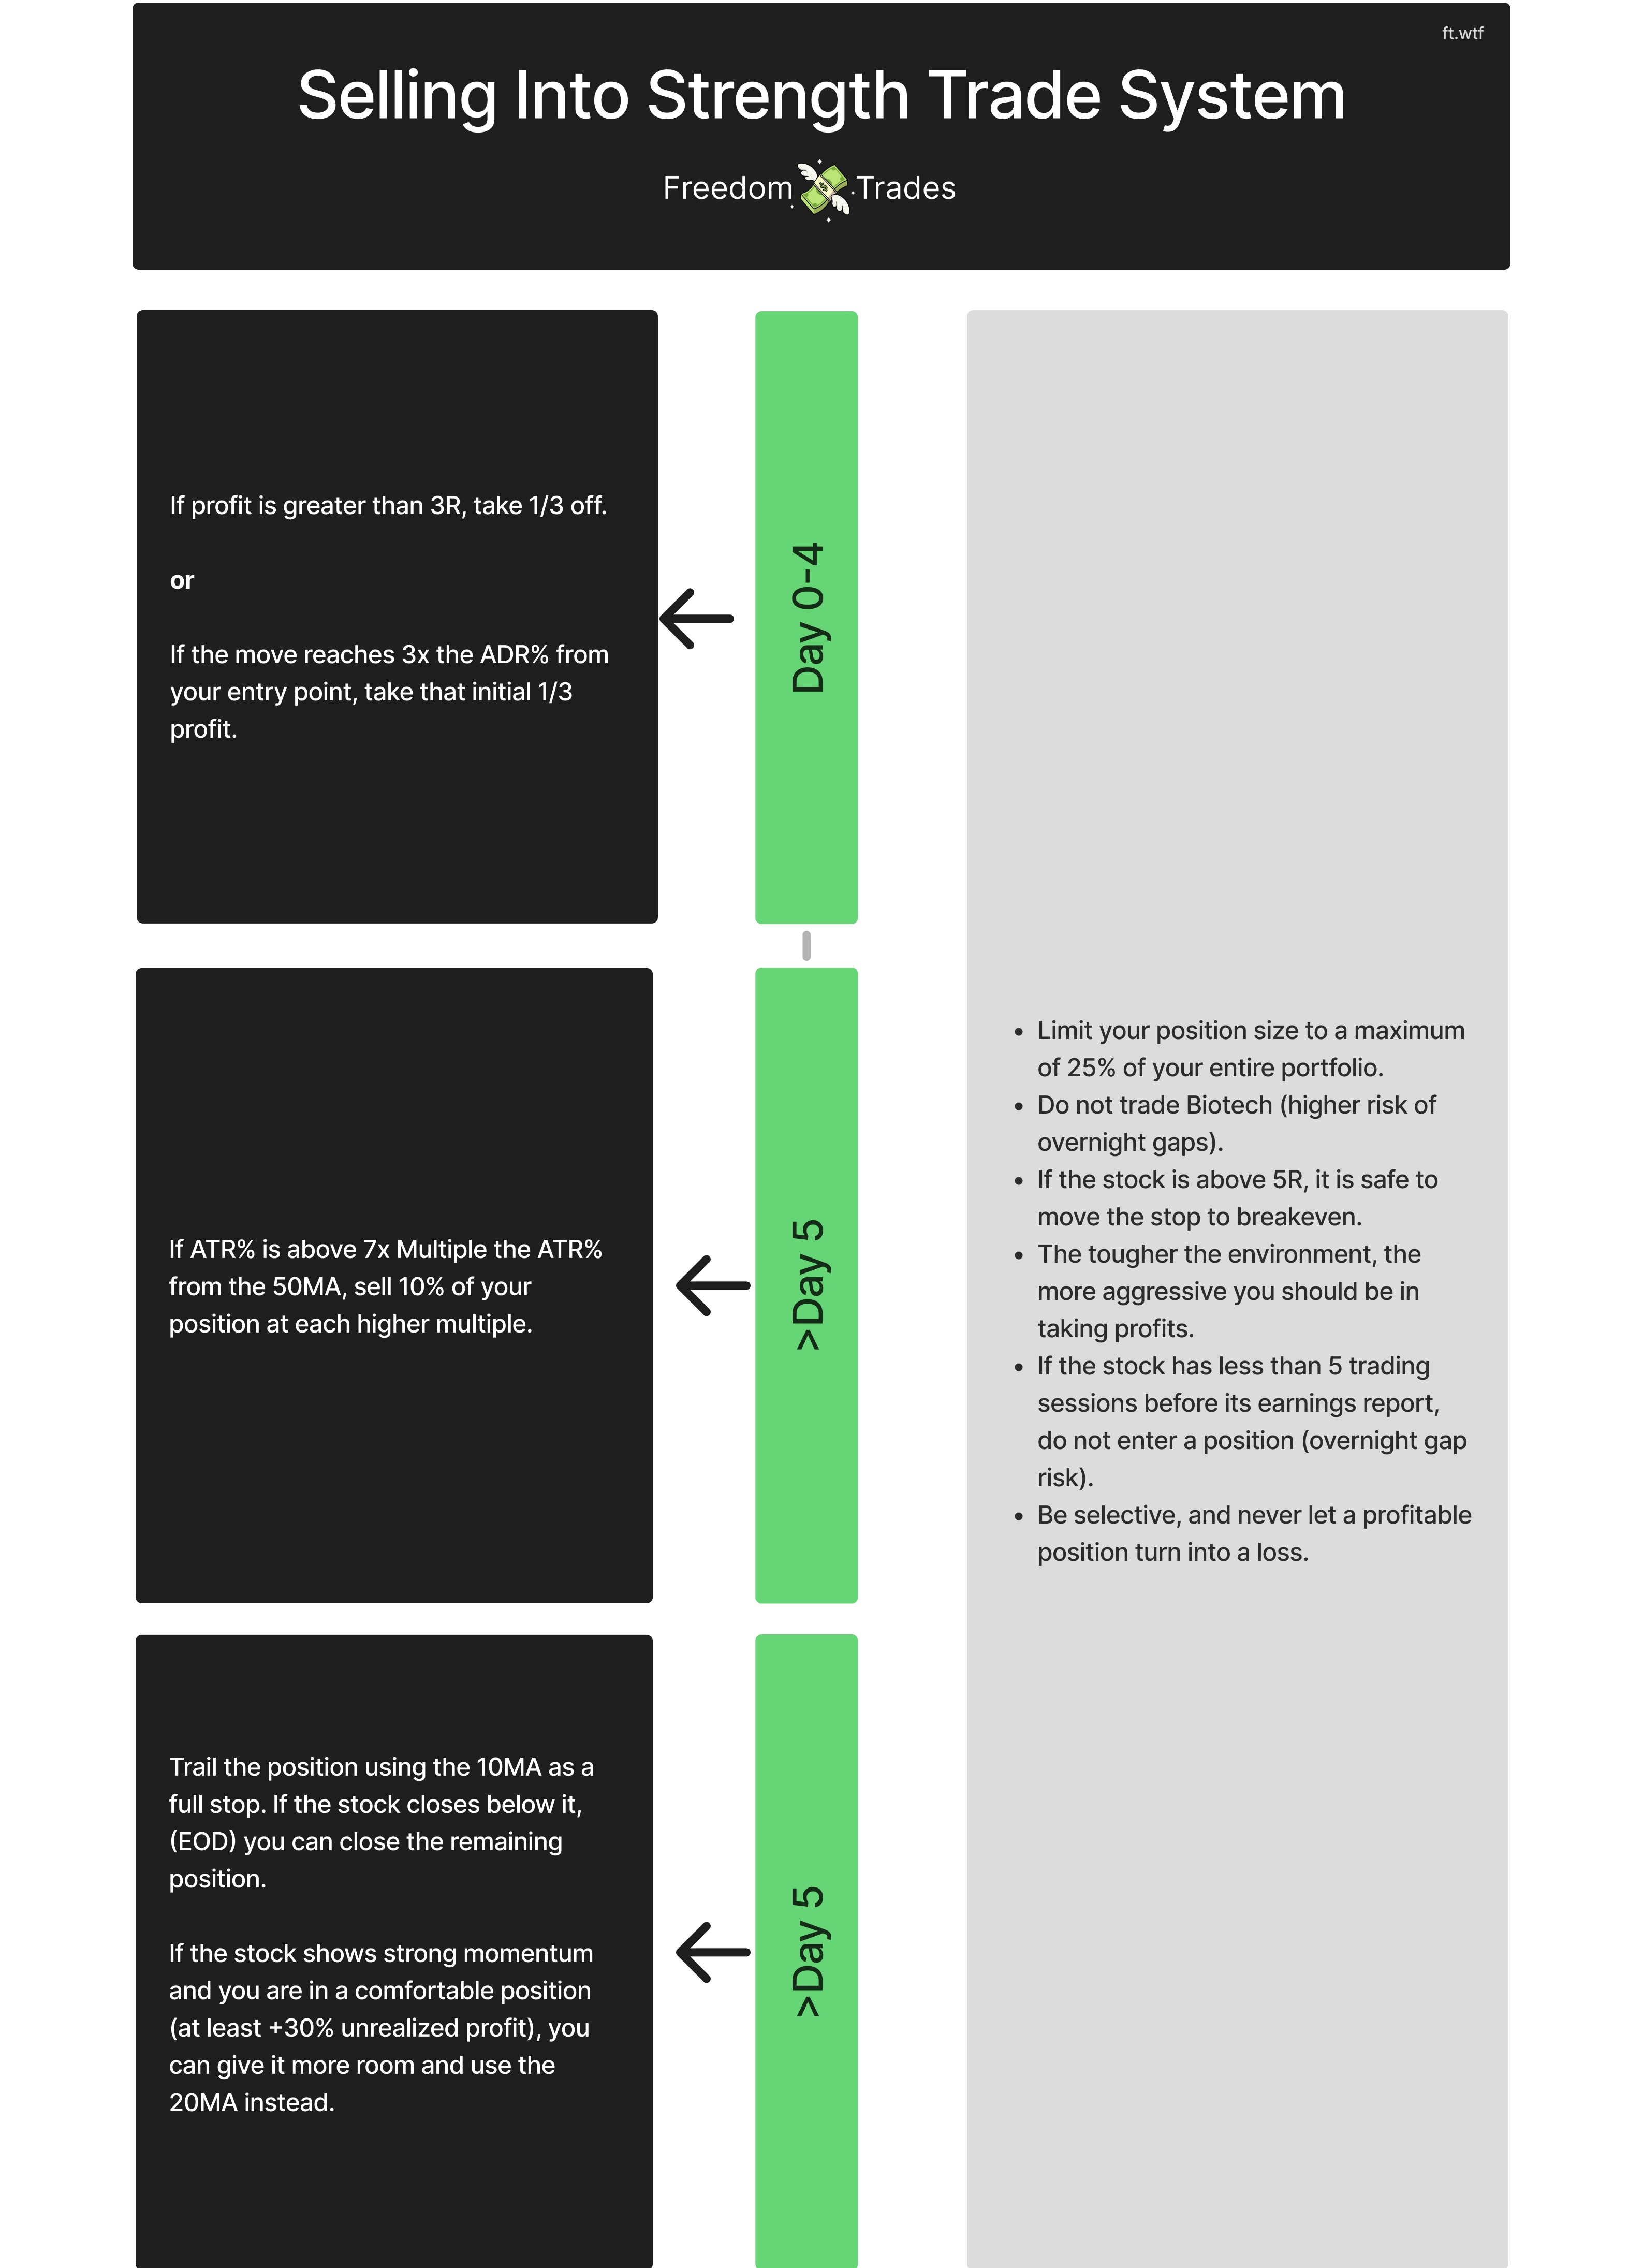
This system only works well when position sizing and trade selection stay tight, so I cap any single position at 25% of the total portfolio and avoid biotech names because of the higher overnight gap risk.
If a stock is already above 5R, I can move the stop to breakeven.
I also avoid entering a stock that has fewer than five trading sessions left before earnings, and above all, I stay selective and never allow a profitable position to turn into a loss.
A real-trade example of selling a stock into strength
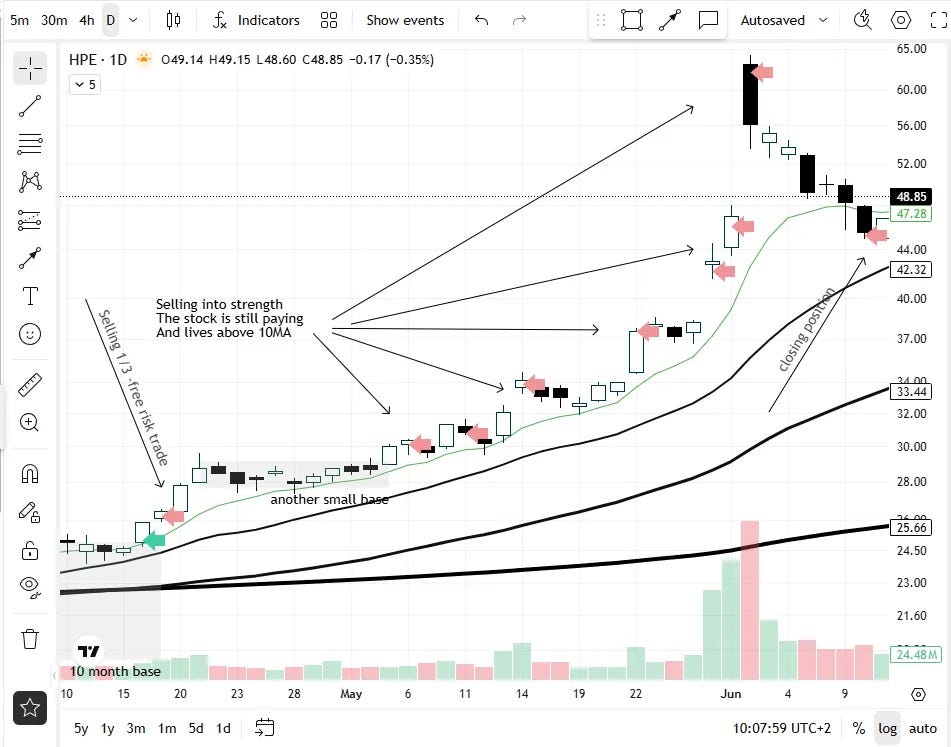
Now I’m going to show you how I made 28R while risking just a single unit of risk.
In practice, I risked $247 and made $7,141, almost 29 times my initial risk.
Below you can see a visual representation of how I managed this trade in HPE stock
And now I’ll show you what the ATR% Multiple from MA indicator looks like.
You can see how, on each strong push higher, it was signalling that it was time for me to trim.
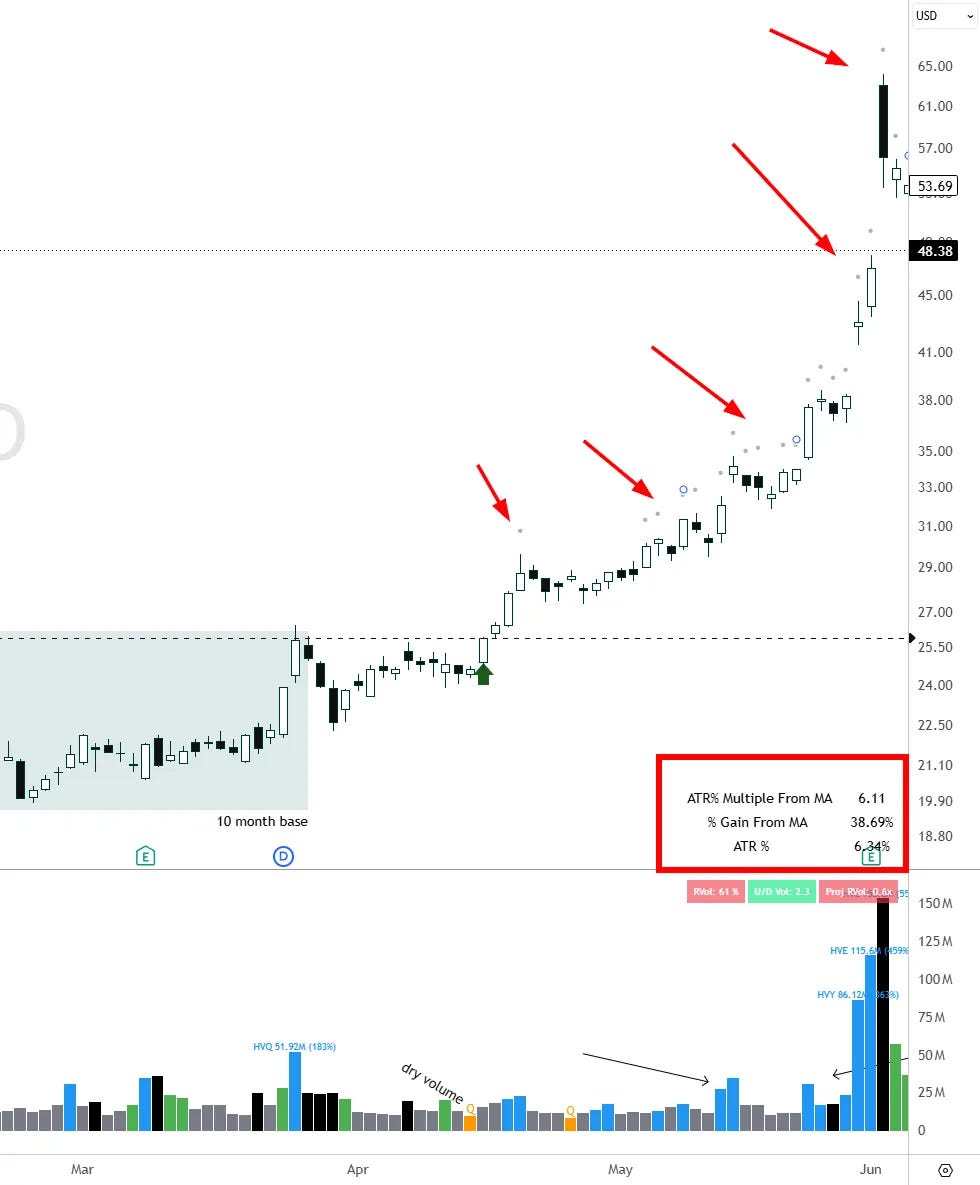
At the peak, the indicator was showing an 18x multiple from the 50MA, so you can clearly see how overextended it was.
And if you look at the HPE chart now, the stock has dropped about 36%.
You absolutely do not want to give back 36% of your profits to the market.
I’ve written in detail about how I managed this trade here, if you want to read more

When you put all of this together, you stop guessing when to sell and start following a clear, repeatable process.
If you want help applying this in real time, with live trade management, structured exits, curated watchlists, and trade ideas you can execute in your own account, then Freedom Trades PRO is built exactly for that.
If you are thinking about joining the community, right now is the best time to do it.
The yearly plan is 49% off.
Click the button, join Freedom Trades PRO with the yearly plan, and come trade with us, in real time.
See you inside :)
Trade Setups of The Week
High Probability Trades for 6 - 10 June 2026

This week’s PRO report breaks down my full momentum stock watchlist, including the setups I’m watching.
You’ll see my portfolio, my open positions, and the exact stocks I’m targeting.. all based on the same swing trading system.
If you want to trade smarter ,not longer , and get my weekly watchlist with setups, and portfolio breakdowns, this one’s for you.
If you think this newsletter could help your friends, share it with them so it can reach as many traders as possible.
And here’s the fun part: when you share it, you can unlock special rewards + you will look smart in front of your friends :)
“One trade closer to freedom.”
Vladislav