


This is the current value of my swing trading account.
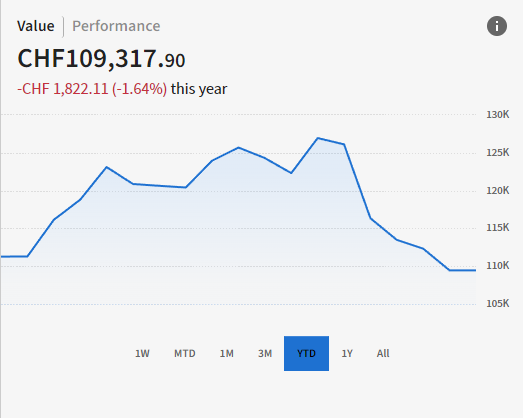
Attention: since I live in Switzerland, the currency is set in CHF (which means if you convert it to USD, the amount is higher).
To better understand the strategy we are following and not to buy blindly without any context, please read and analyze my strategy carefully:

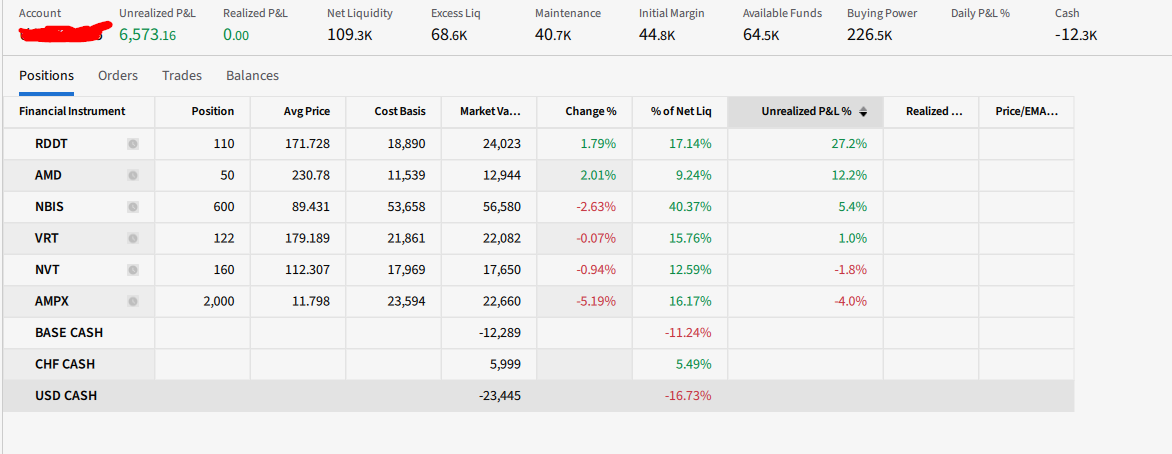
Right now, these are my positions:
What a week…
As many of you know, Tuesday caught me off guard. I wrote more about what happened here:
Looking back, it was the right call.
In hindsight, my account would be about $20k higher if I had just held. But that would train my brain to think it’s okay to mess with stop losses and risk management and that “it works”… until it doesn’t.
I respected every stop. I followed my risk plan. And I’m proud of that.
I’ll probably go deeper on this in my monthly review next week.
How do you spot 10x movers before they explode?
Before we start with Weekly Market Direction, I want to answer a question I’ve been getting a lot in DMs: “How do you spot 10x movers before they explode?”
The best way is simple: study last year’s leaders.
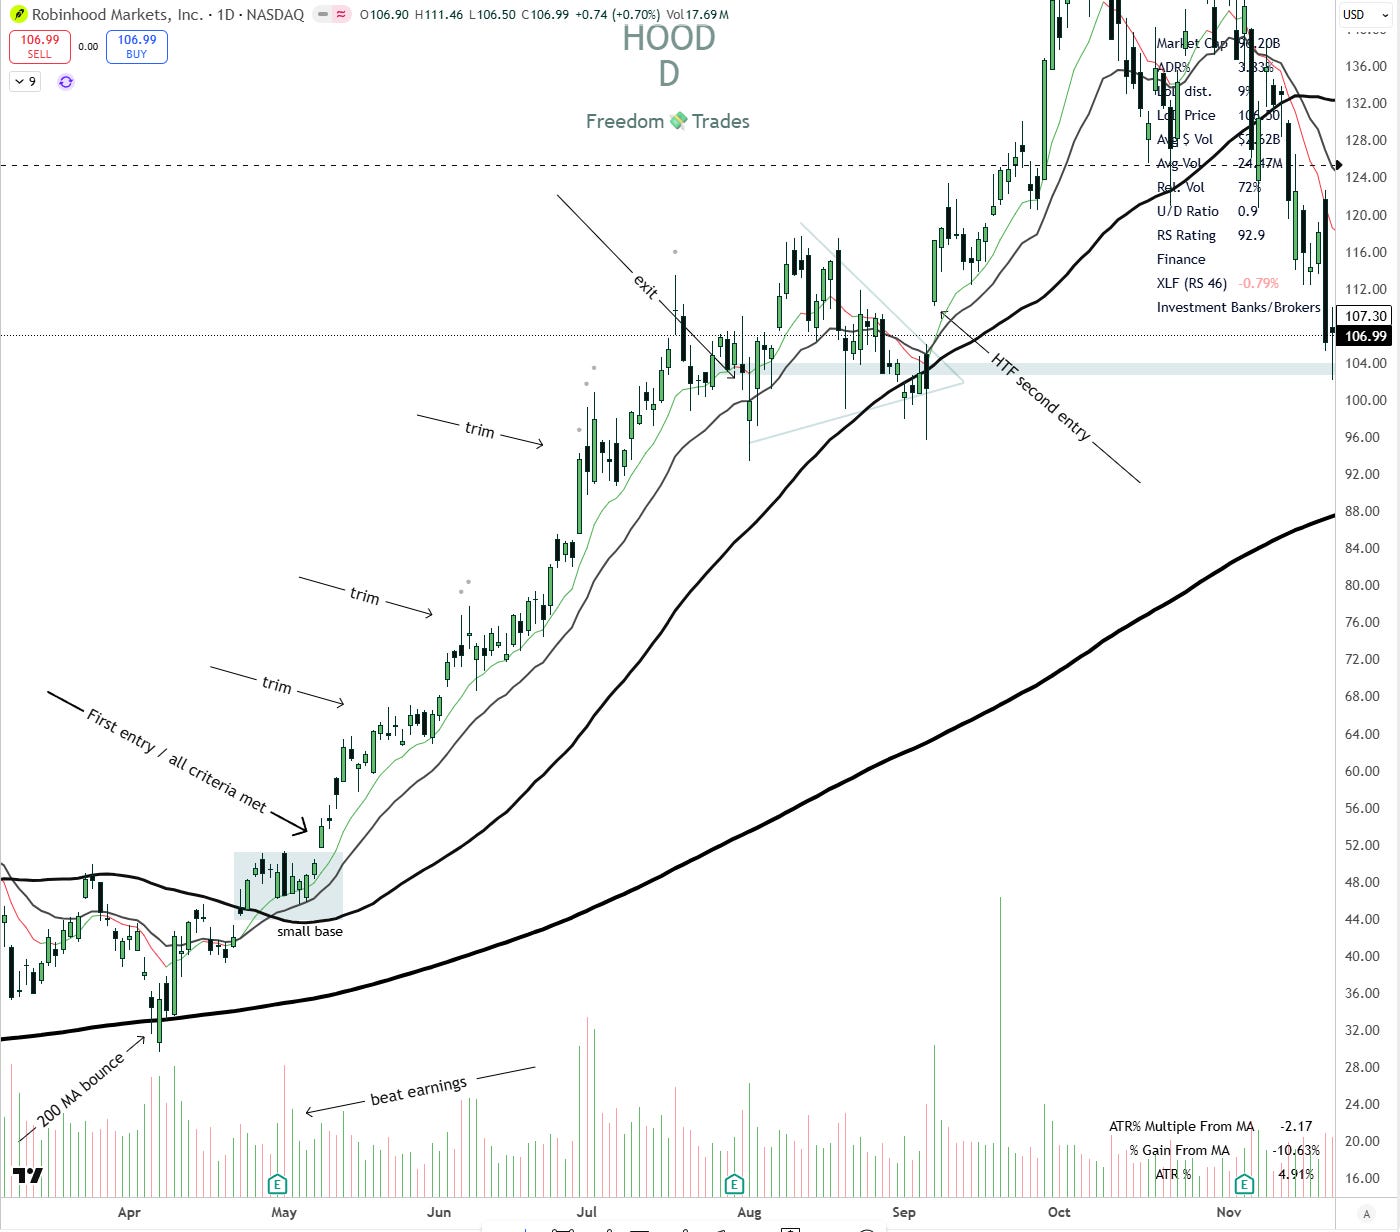
How did they move? How big was the base before the breakout? What did volume look like on breakout day? What clean setups showed up along the way? Where were the entries? Where would you have exited using this system?
So I’ve got homework for you.
I pulled 107 tickers using these filters: Price > $4, Market Cap > $400M, 1Y Performance > 100%, ADR > 4%, US stocks only.
Here’s the scanner: https://www.tradingview.com/screener/8sbkDbrw/
Here’s the public Google Sheet where you can pull all the tickers:
https://docs.google.com/spreadsheets/d/1U4GCO_4jFP1DYmFtk7HAIQpai5bku2OU3Z650ojkR1I/edit?usp=sharing
Now take each ticker and study it.
Here’s an example:
Weekly Market Direction
This week was a perfect reminder that headlines can punch you in the face on Tuesday, then act like nothing happened by Wednesday.
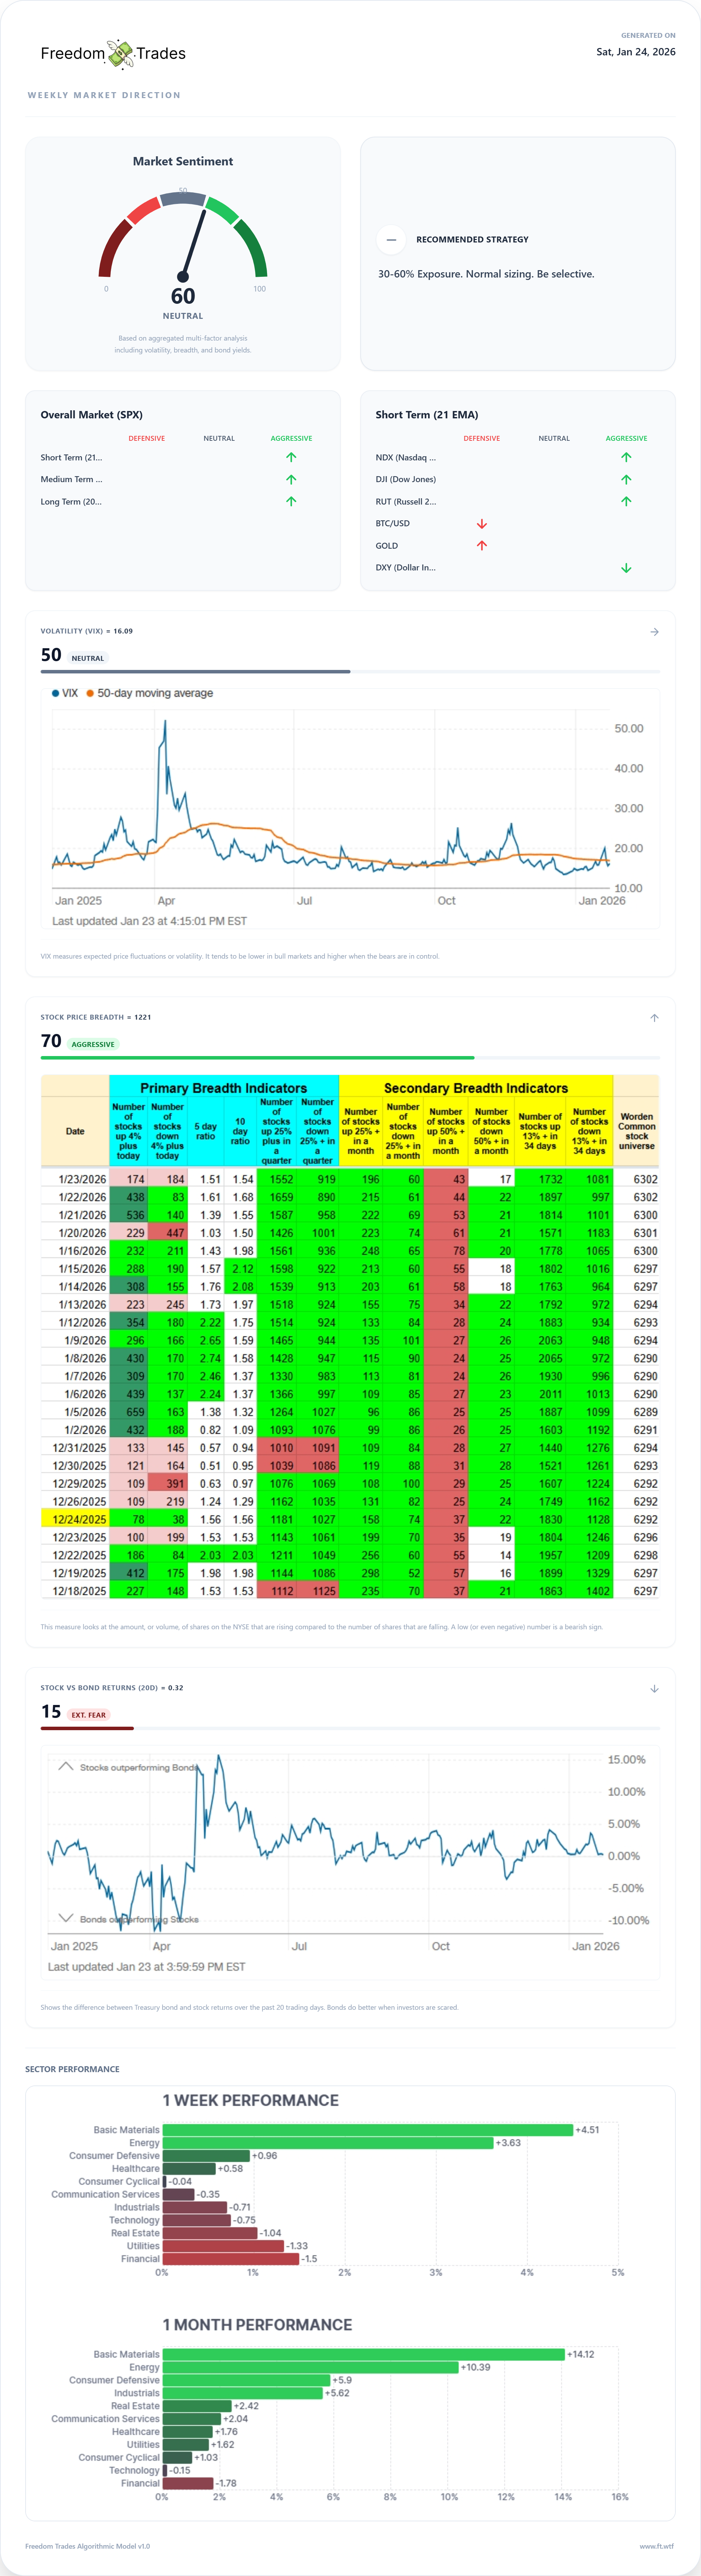
Our model sits at 60 (Neutral). Not bearish. Not “all-in.” Just neutral, with a green bias if the tape keeps behaving.
The play stays the same: 30 to 60% exposure, normal sizing. (I’m going to cut sizing because I’m in drawdown, and I’ll only scale back up as clean opportunities show up. I don’t get bonus points for trading big while I’m trading bad.)
What the market actually did
U.S. indexes finished lower in a choppy, holiday-shortened week:
S&P MidCap 400: -0.55%
Dow: -0.53%
S&P 500: -0.35%
Russell 2000: -0.32%
Nasdaq: modestly lower
Tuesday was the mess. The S&P 500 had its largest daily drop since October after Trump threatened new tariffs tied to the Greenland drama. Then Wednesday we got the “never mind” post, and markets bounced.
That’s the theme right now. Policy headline hits, then fades fast.
Greenland drama, dollar pain, gold flex
The Greenland scare hit markets hard because it looked like a fast track to more tariffs. Trump threatened 10% tariffs on Feb 1 on eight European partners, rising to 25% by June if no deal happened.
Then the deal framework showed up quickly, focused on U.S. security interests, without blowing up sovereignty. Markets rebounded.
The bigger signal was the dollar. The trade-weighted dollar fell 1.2% on the week, the worst week since last June, and it stayed weak even after the “deal” news.
Gold is up 15% year-to-date, after 65% last year.
Fundamentals took the mic again
Under the headlines, the U.S. backdrop still looks solid:
Q3 GDP revised to 4.4% annualized (from 4.3%)
Core PCE (Nov): +0.2% month over month, +2.8% year over year
Jobless claims: 200,000, and the 4-week average is 201,500 (lowest in two years)
Continuing claims: 1.849 million
Consumer sentiment: 56.4 (up from 52.9)
The base case still looks like 1 to 2 cuts of 25 bps in 2026
High Probability Trades
You can find my full watchlist here:
https://www.tradingview.com/watchlists/317808730/
As always, please keep an eye on Discord, as I call these out in real time as they unfold.
Ticker: WULF
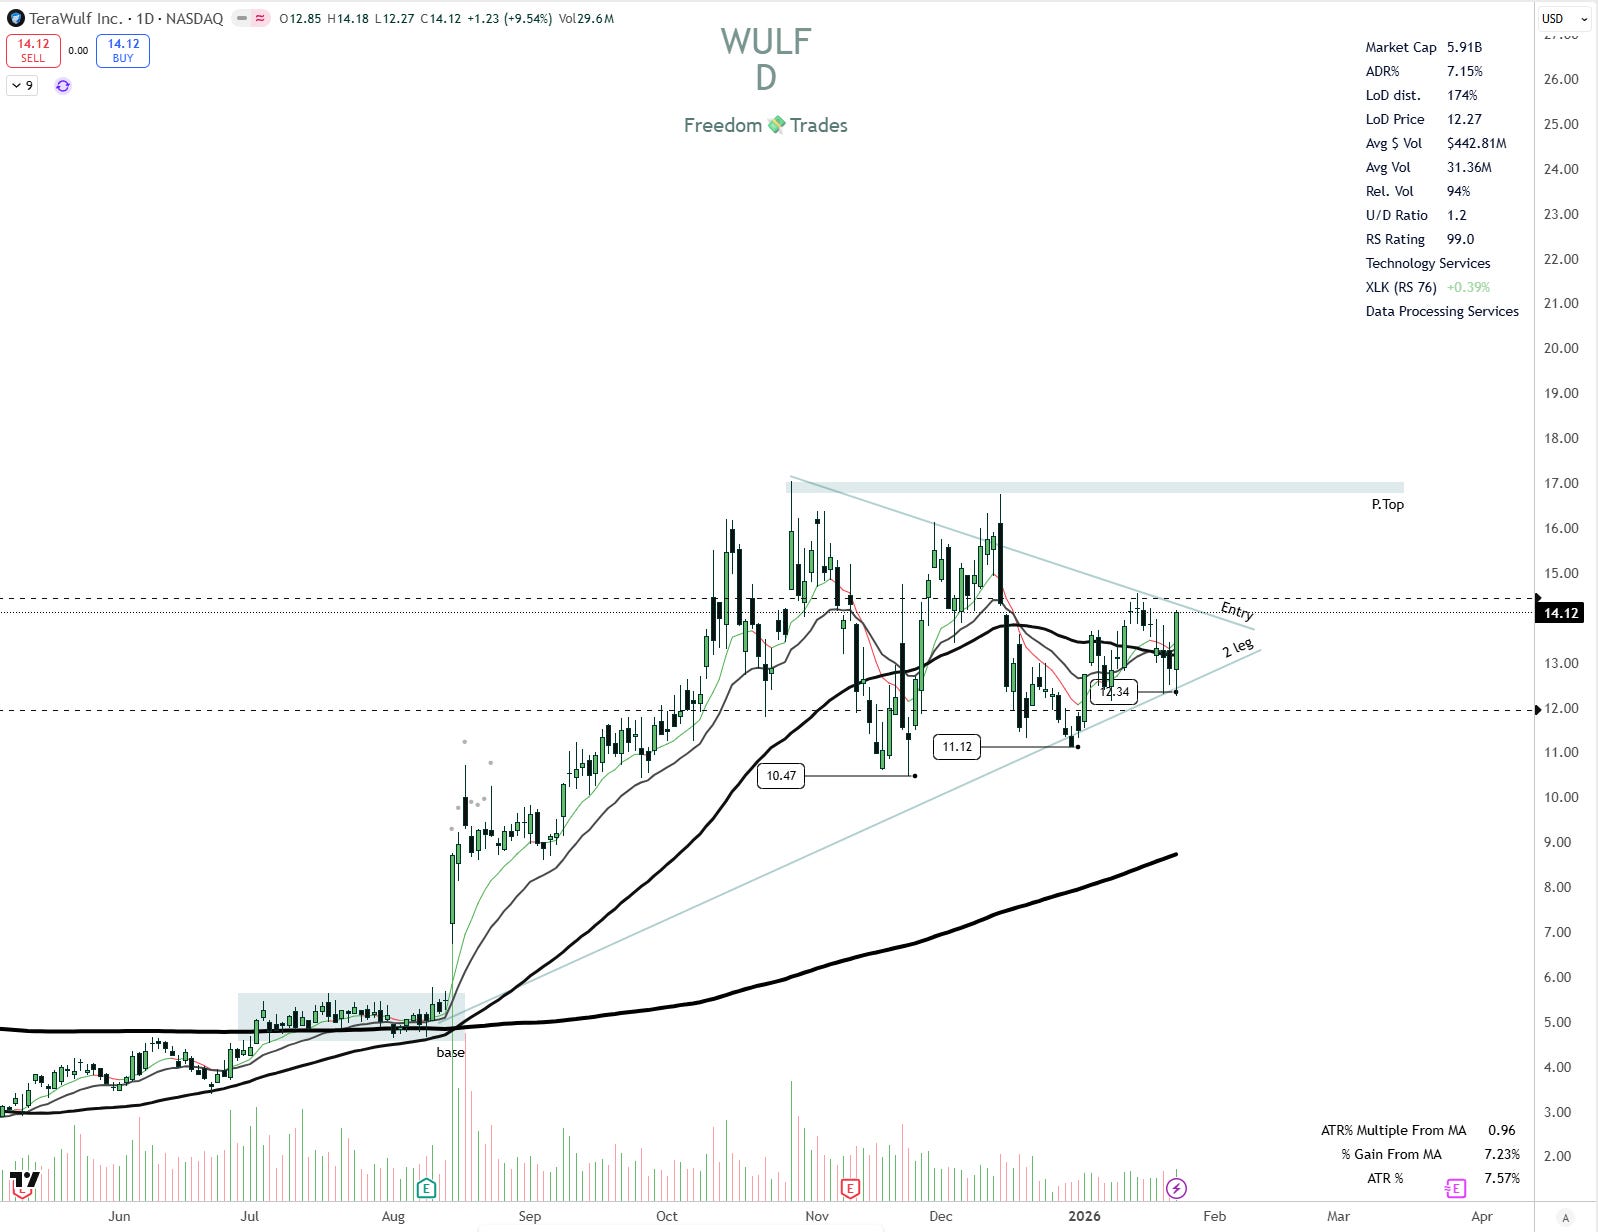
We’ve got lower highs on WULF, and price is starting to compress in the $12 to $14 range. After a 200% run off the last base breakout, it looks like WULF may be setting up for a second leg up.
How I’d play it: set a price alert at $14.50 and trade the triangle breakout. Place your stop at the low of day or the previous low of day, and keep the position size smaller.
Ticker: APLD
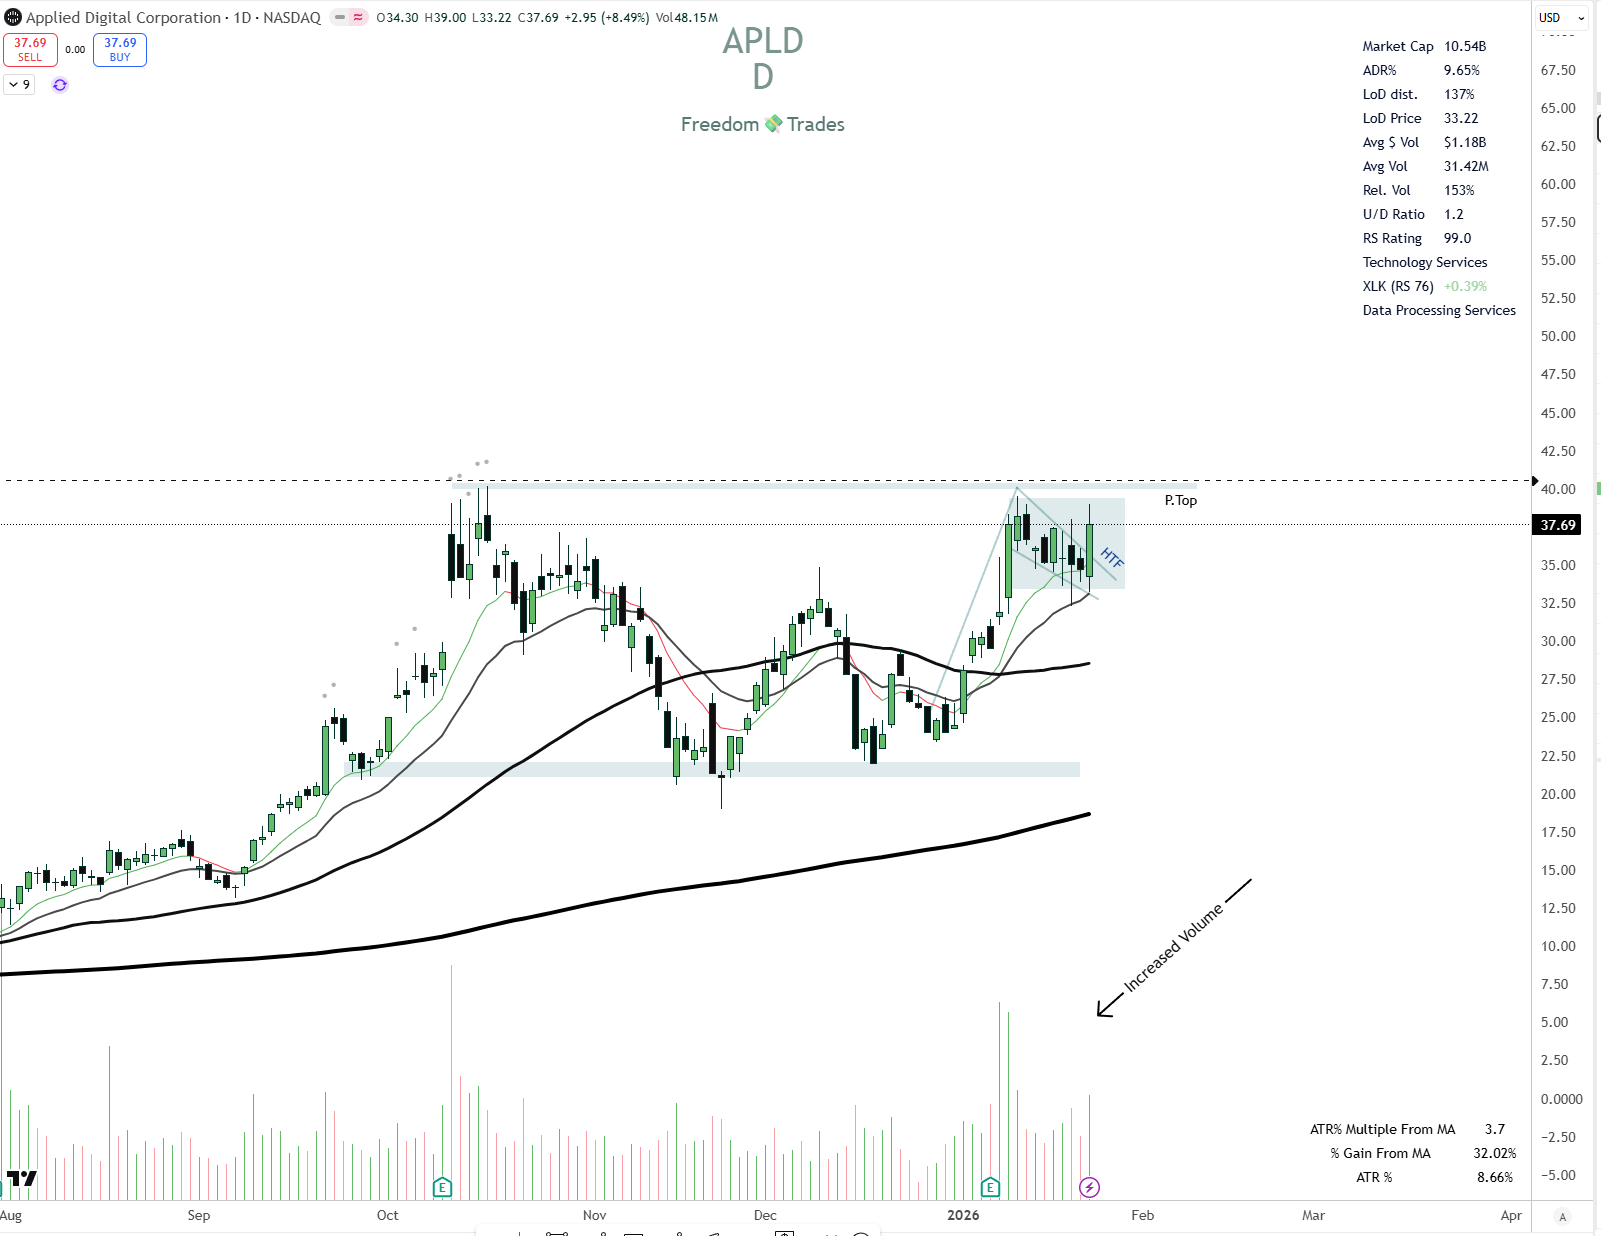
APLD just beat earnings, with sales up more than 250%. The market is reacting to that, and there’s a real chance it breaks out above the prior top.
What I recommend: be careful if it opens with a gap up on Monday. If the ATR% Multiple from the MA is above 5, skip the trade. Worst case, take it with a smaller position. Set your stop at the LOD or previous LOD.
Ticker: HUT
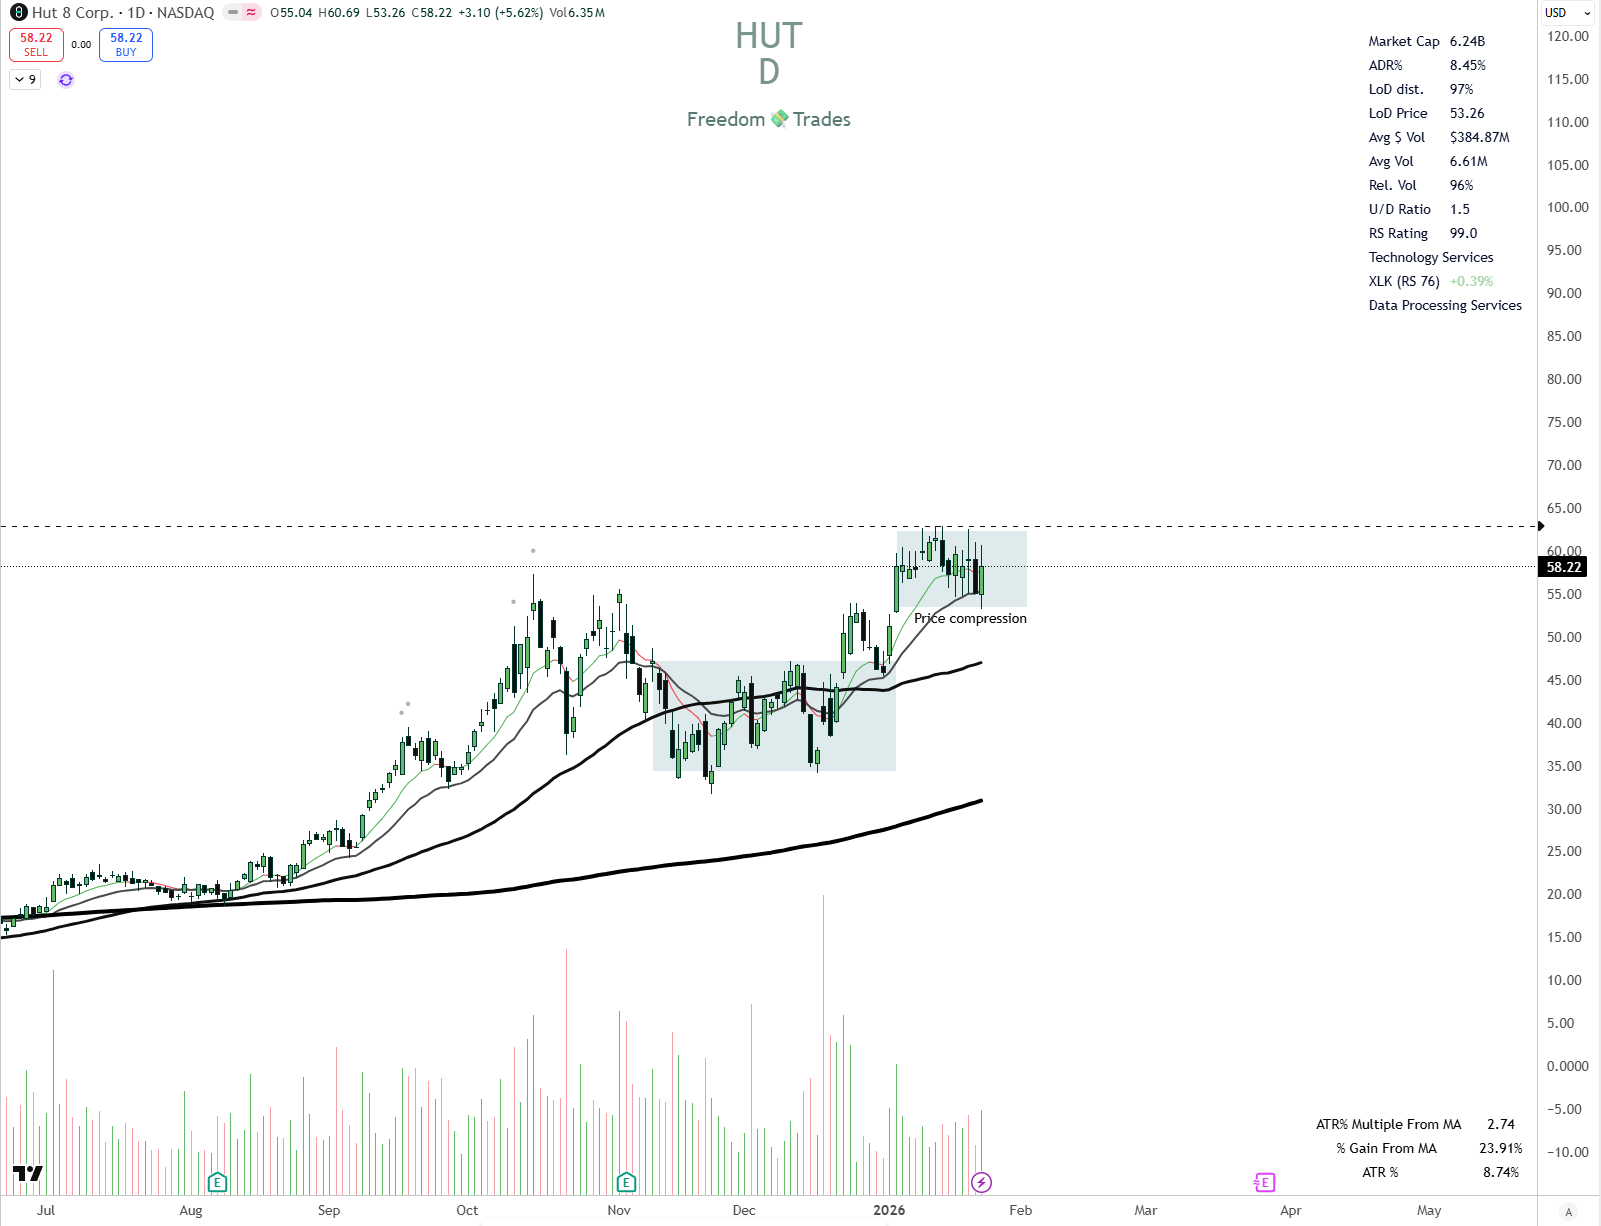
HUT is showing incredible strength after breaking out of the previous base. It’s holding that level really well even on red days, especially compared to the ETF it belongs to.
How I’m going to play it: I’ll set a price alert at $63. As soon as it breaks, I’ll buy the breakout and set my stop loss at the low of day.
Other interesting tickers you should keep an eye on:
CIFR, RGTI, APLD, SSRM, VRT, ONDS, IREN, CORZ
Important links to read and understand:
🟢How to define whether a setup is A+, A, or B. (Click here)
I encourage you, if you’re already a PRO member, you can upgrade your membership on the Discord server (at no extra cost) and get access to a fully private server dedicated to PRO members, for networking, trade ideas, insights, and alerts. (I am wayyy more active there than the Substack chat)
Connect PRO account with discord server
P.S.: The email you use on Discord must be the same as the one on Substack.
All the positions I take during the week can be found on the Discord server or in the Freedom Trades private chat.
If you get an error or can’t make it work, message me privately, I might be able to help you out. 🙂
“One trade closer to freedom”
Vladislav