

The tool has been live for a week, and we’re already receiving some positive feedback from members.

The tool’s workflow is:
You build your focus list using the stock selection tool
You look for setups using the Freedom Trade strategy
You add the tickers from your focus list to Entry Radar
You set up an alert and wait for the signal
By using this tool, your win rate will improve and your overtrading will decrease as you will get more selective with your entries and stock selection.
It will eliminate the discretionary part of the strategy, and you’ll stop guessing when to enter and when to sit on the sidelines.
In this article, we’ll learn how to use the Entry Radar and Stock Selection Tool
How to get access
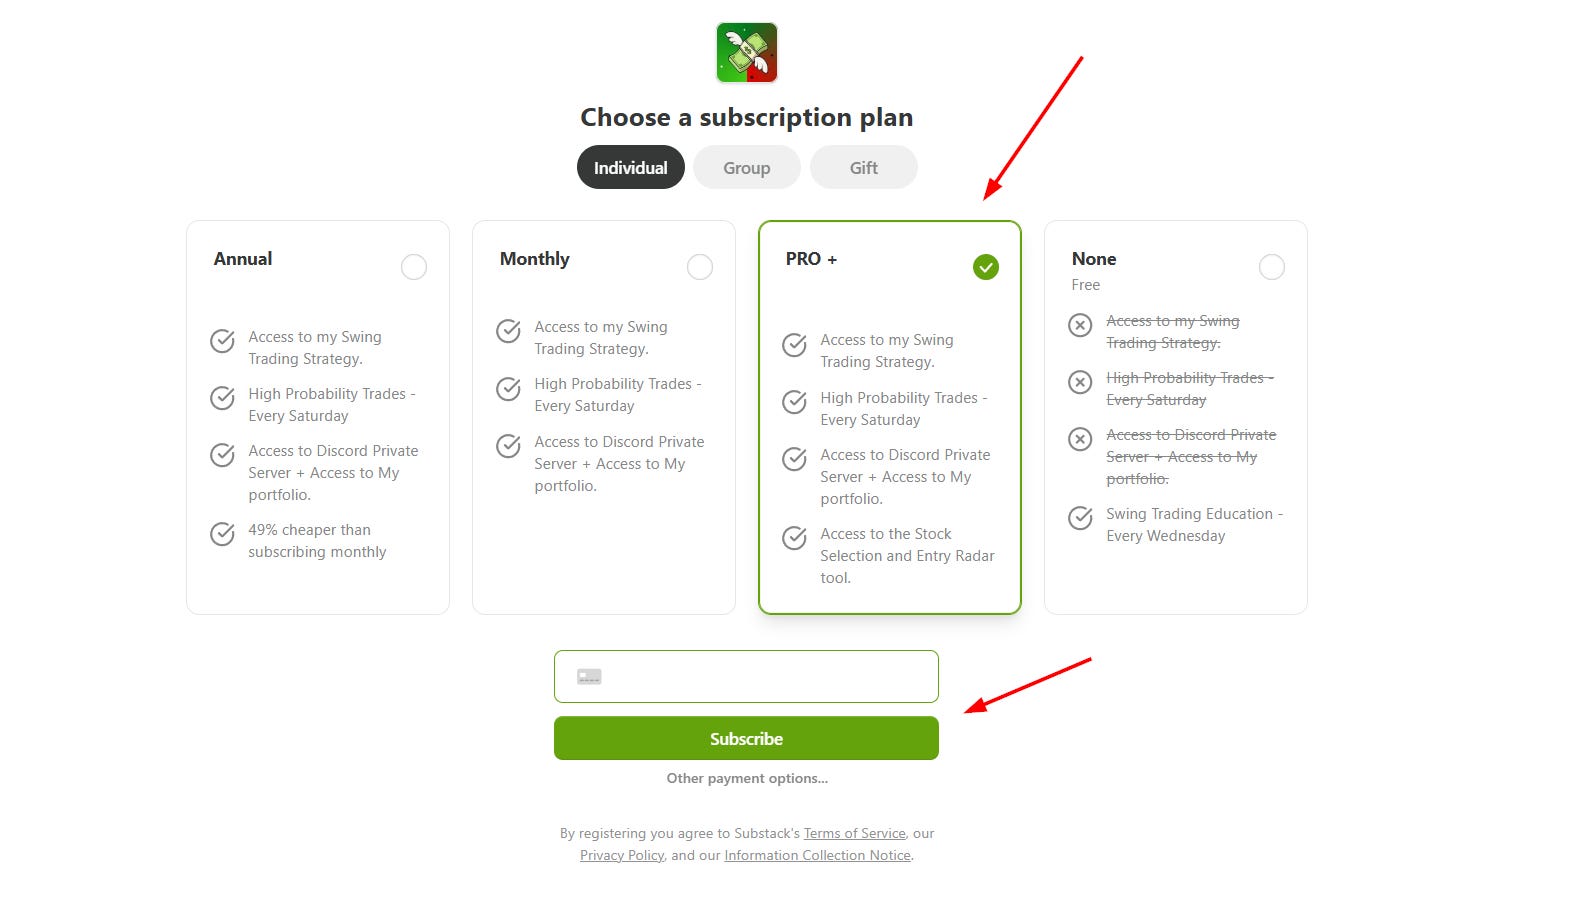
To access the tool, you must be a PRO+ Member of the Freedom Trades community.
There are 3 simple steps.
Go to ft.wtf/subscribe
Select the PRO+ plan and subscribe
Send me a DM on Substack with your Tradingview username.
How to install the tool
Once you receive access, you simply :
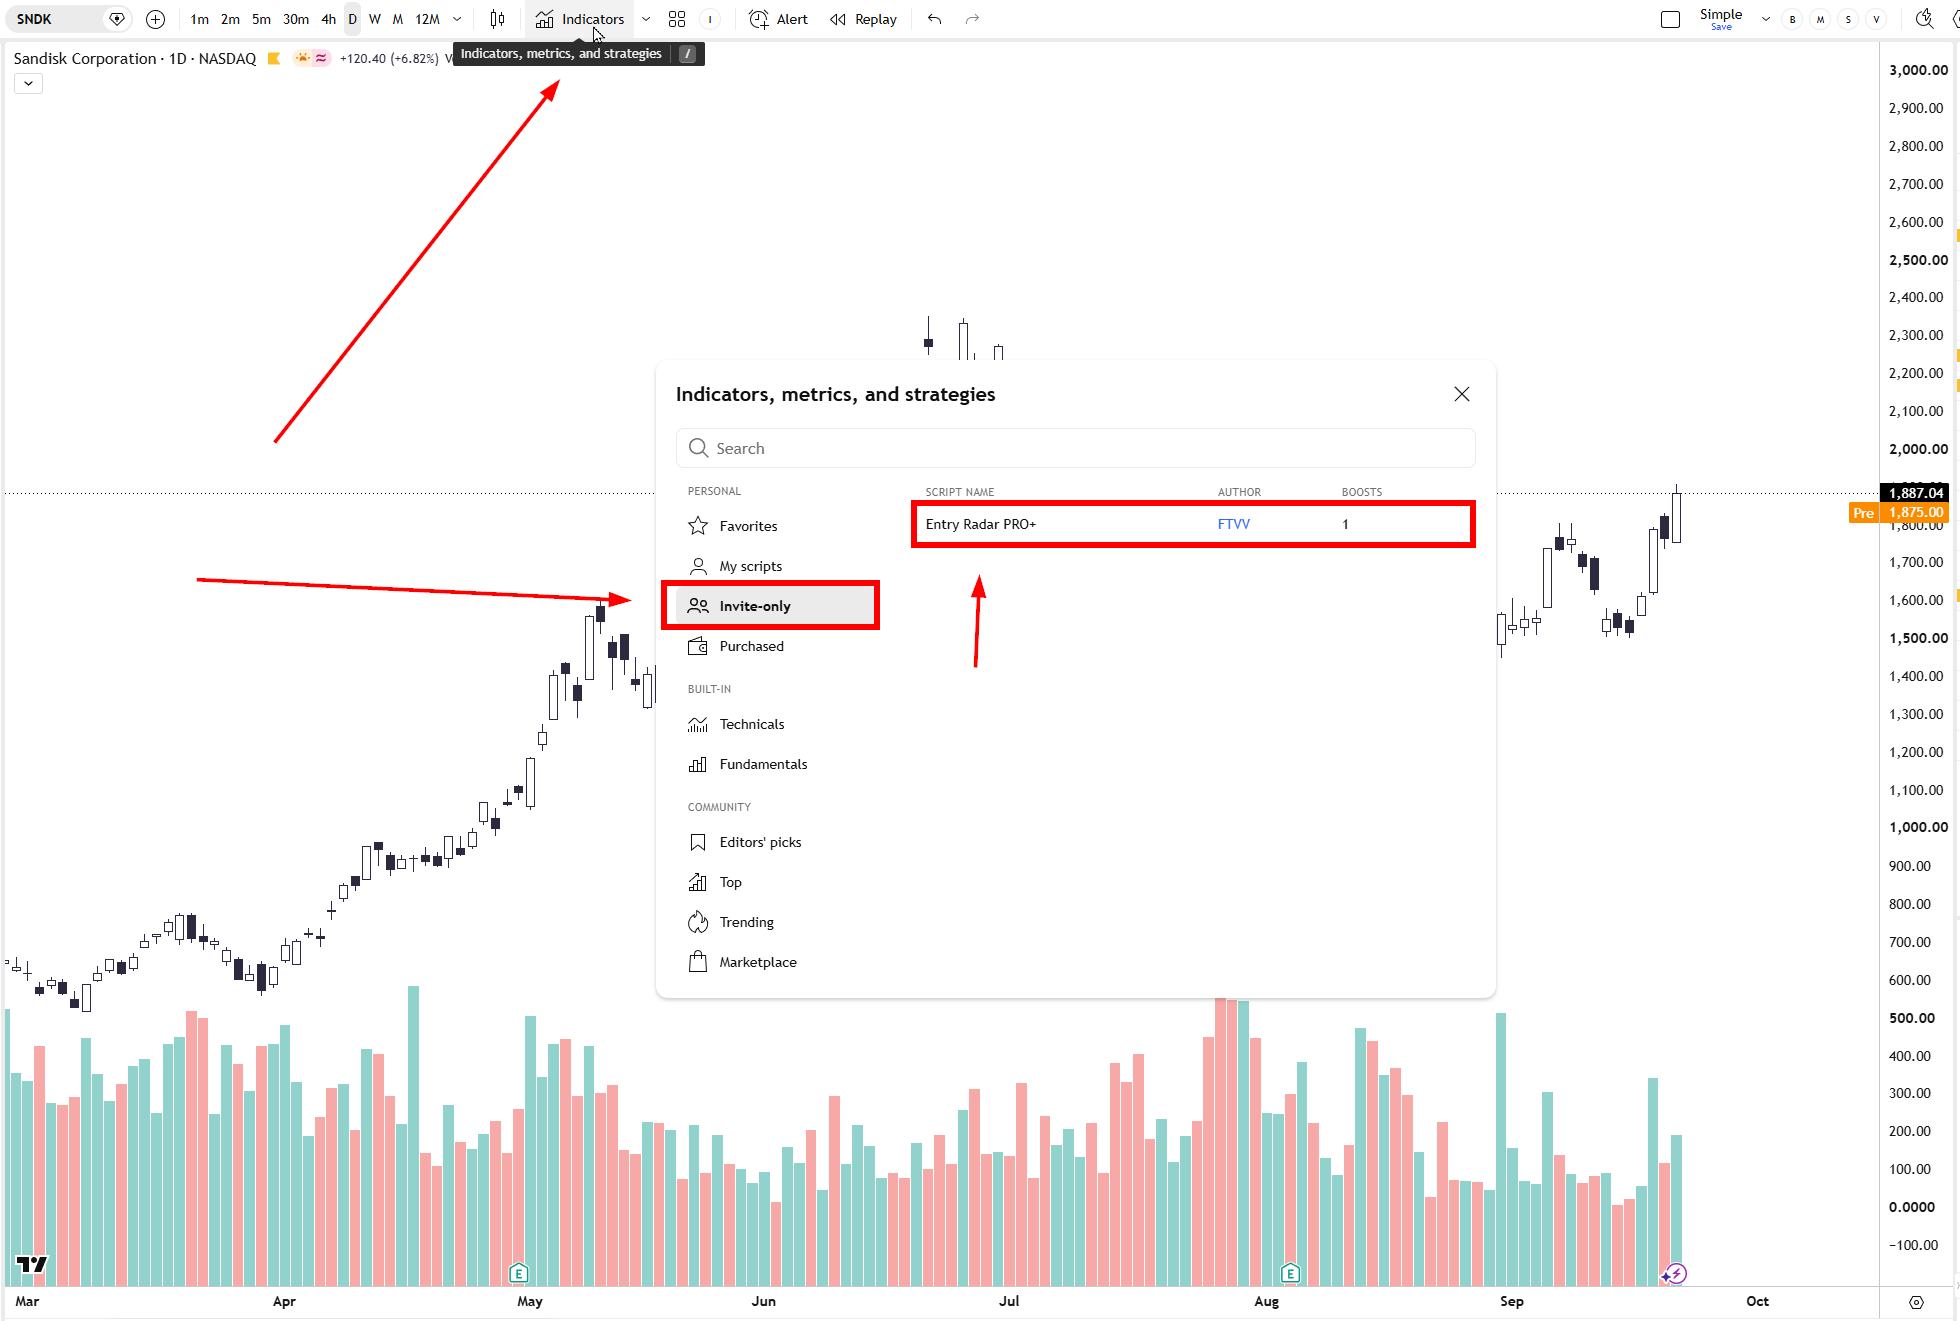
go to the TradingView chart, Select Indicators.
Select invite-only
Select Entry Radar PRO+
Now I’m going to tell you what you should pay attention to and how each one works
How the tool appears on the chart
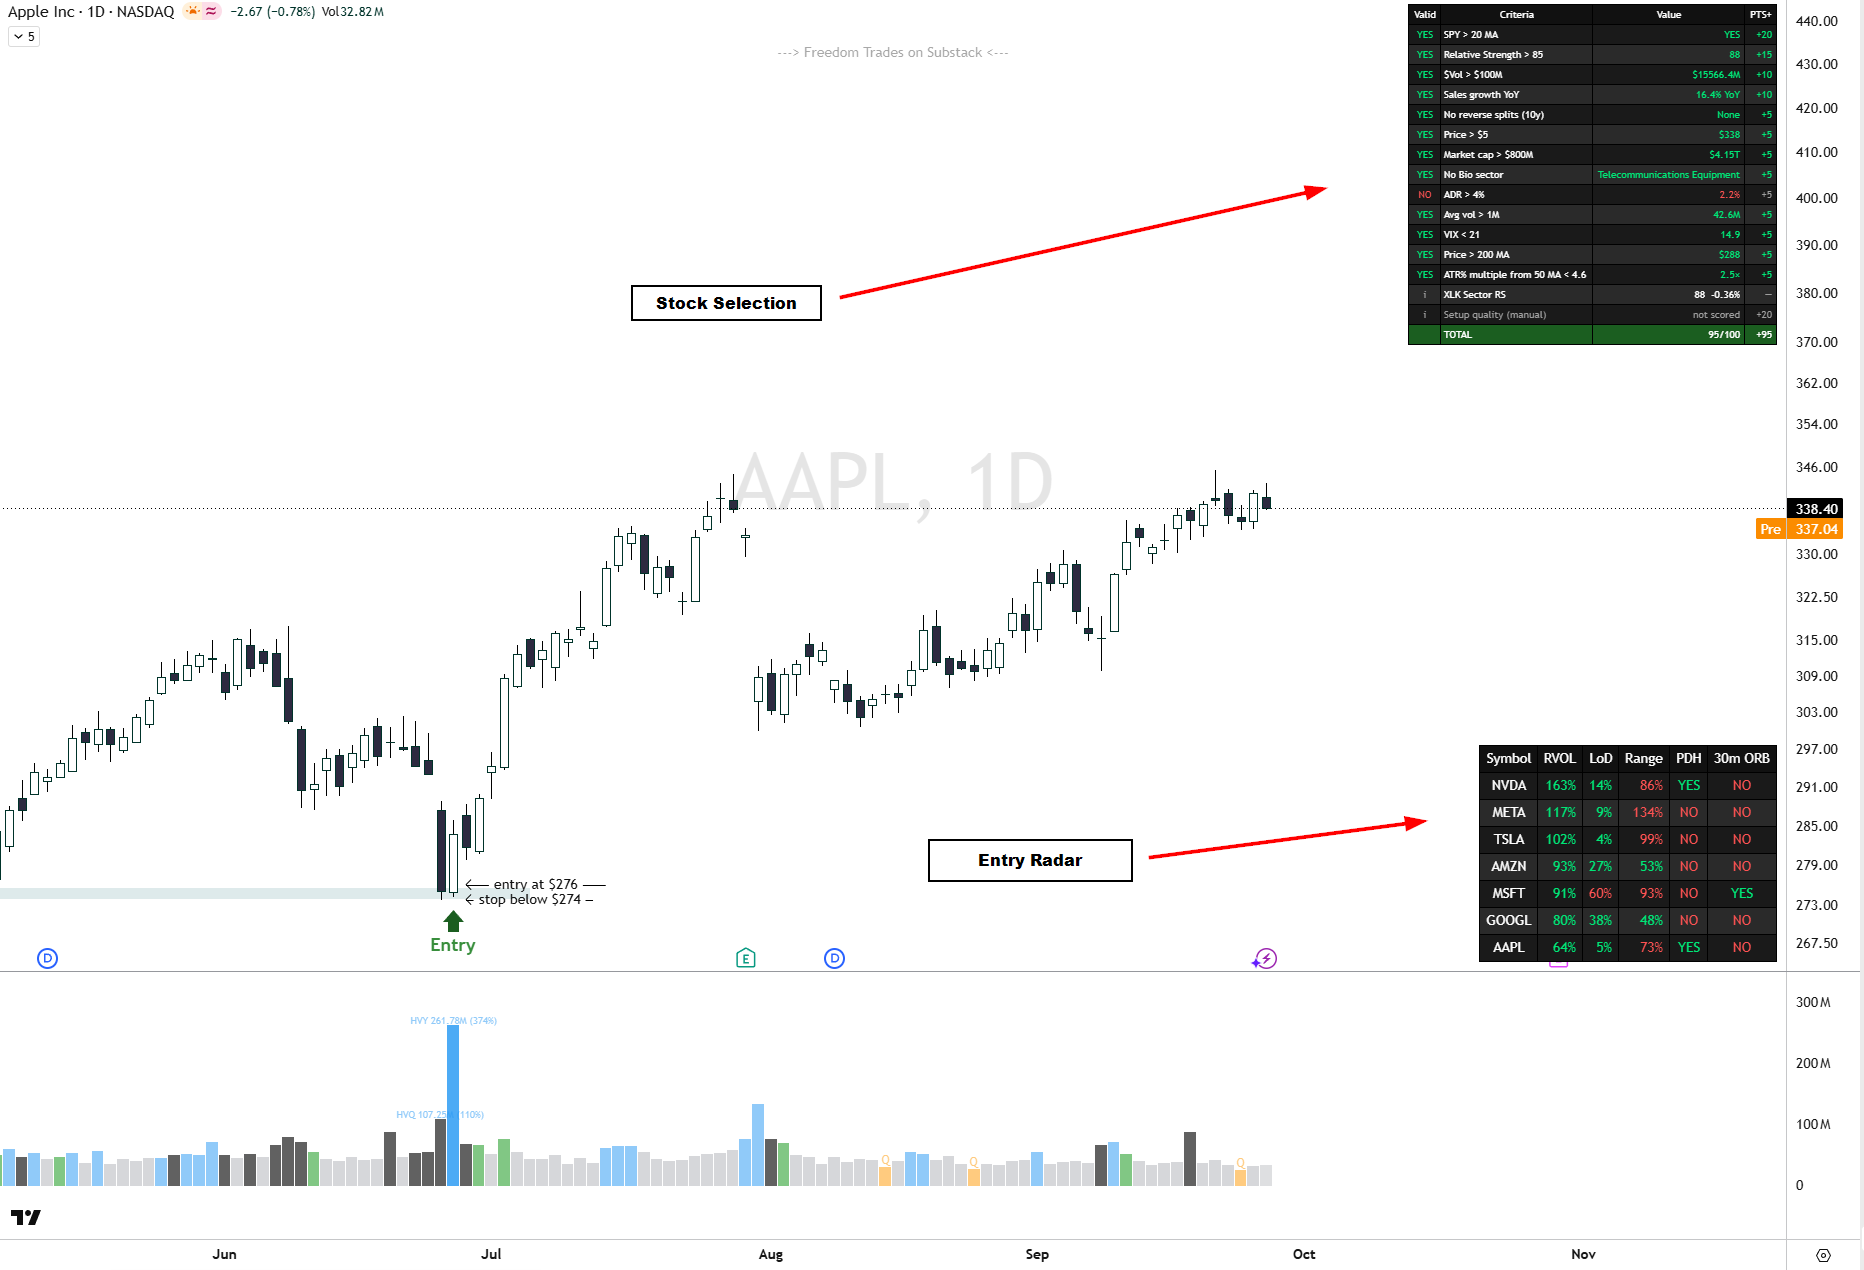
Stock Selection - How It Works
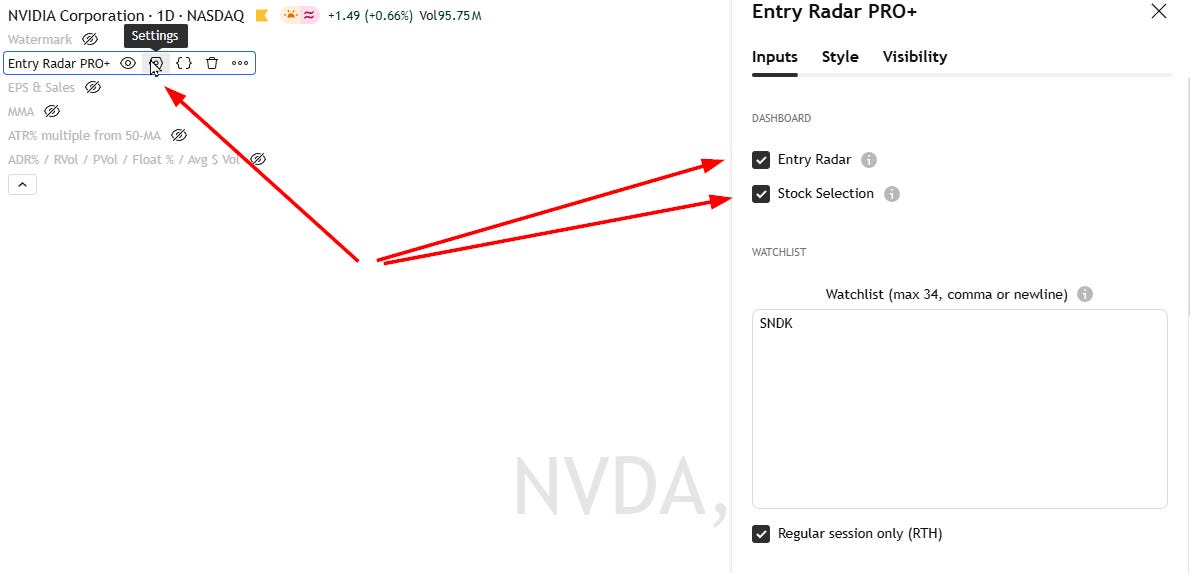
To enable it, simply go to the indicator settings and enable “Stock Selection” and/or “Entry Radar”
There are 13 criteria the tool uses to calculate the score.
All of these criteria are part of the Freedom Trades Strategy.
Before this tool, there was a checklist you had to follow. That took a lot of time, but this tool calculates everything for you, so you no longer have to sit there wondering whether or not you’re sticking to the plan.
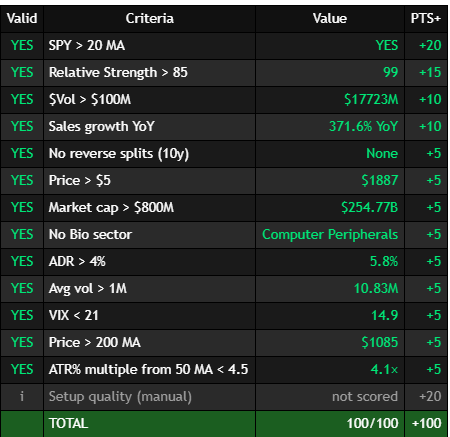
In this example, SNDK receives a score of 100 out of 100.
The filter takes into account three key components of our strategy:
How the overall market is performing (we know that 3 out of 4 stocks follow the overall market)
The stock’s price action
The stock’s fundamentals
And it calculates all of this in REAL TIME.
So, the market conditions, fundamentals, and price action are all in place for it to gain 100 points.
Now, my recommendation is:
DO NOT TRADE ANY TICKER THAT GETS LESS THAN 80 POINTS.
There are over 10,000 stocks listed in the U.S., ask yourself, why wouldn’t you buy the best products out there?
It’s your money. When you go shopping, you look for the best product out there, and that’s exactly what you should do when you want to invest your money in a stock.
The purpose of this tool is to help you select stocks!
This means that if a stock scores below 80, you shouldn’t even look for a trading setup, just skip it!
The tool also takes into account how the overall market is performing.
When the SPY is above the 20MA, the tool will instantly subtract 20 points, so it will tell you to stay on the sidelines and that it’s better to hold cash.
All criteria are customizable based on your strategy, but if you want to follow the Freedom Trades Strategy, I recommend leaving them as is.
You can also customize the size of the table and its position on the tool’s dashboard.
This tool does not replace the need for setup, you still have to look for setups (I’ve shared all the setups we use here).
Once you build your focus list using this tool, you look for setups and then add all the tickers to the Entry Radar +
Entry Radar + How it works
To enable the “Entry Radar” feature, simply go to the indicator settings and select “Entry Radar.”
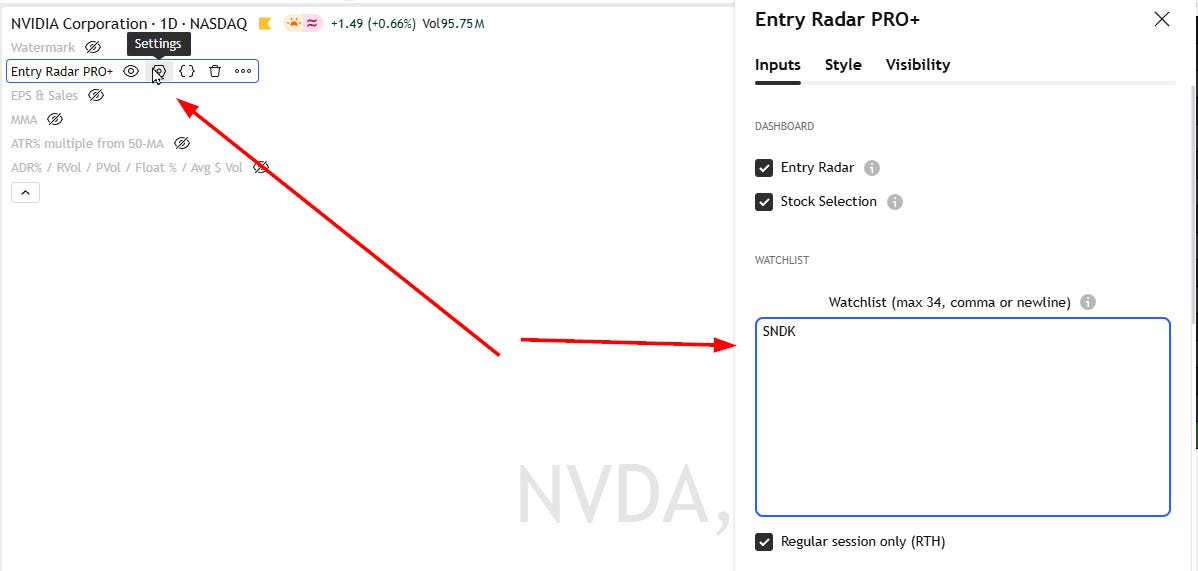
Now, in the Dashboard under “Watchlist,” simply paste or type all the tickers from your focus list.
The tool supports up to 31 tickers, which it can monitor in real time.
The entry is based on 5 key criteria:
RVOL
LOD <% ATR
Daily range < % ATR
Previous Daily High
5 ORB or/and 30 ORB
Basically, if all these criteria are met, the ticker turns green.
VERY IMPORTANT - TOOL LIMITATIONS
There are nuances, as with any tool, the success rate can’t be 100%, otherwise, everyone would get rich, right?
I want you to pay very close attention here to what you need to look for.
You want to see RVOL higher than 30% within the first 30 minutes, up to a maximum of 120 minutes after the market opens.
If this doesn’t happen, it means this isn’t a good day for a breakout since the volume is so low.
On a day when the ticker breaks out, we want to see at least 140% RVOL at the close, a sign that institutions are accumulating the stock and buyers are in control.
However, if the stock advances and breaks out on low volume, many of these breakouts won’t be meaningful and will fade either that day or in the following days.
If the ticker in question meets all the criteria and starts alerting you, but 90 minutes have already passed and the RVOL is below 30%, I want you to ignore that alert.
You’ll see that at the end of the day, many stocks tend to spike, but as I said, these aren’t valid signals because it’s normal for the RVOL to be above 30% after 4–5 hours into the session.
What you actually want to see is massive volume in the first 30–60 minutes, with a 30-minute ORB and the price exceeding the previous day’s high, while the range and LOD are below 60%.
That’s when it’s time to buy.
How to Customize It
There are plenty of ways to customize Entry Radar
Simply select the “Settings” option on the indicator, then scroll down in the “Inputs” menu and change the parameter you want.
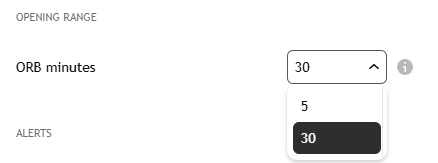
You can change the opening range to either 5 minutes or 30 minutes.
You can also change the table’s position and size anywhere on the chart.
You can also change the colors and the timeframe on which it appears.
How to Set an Alert for Entry Radar
You don’t have to sit in front of your computer 24/7 waiting for a ticker to turn green.
You can set an alert.
Make sure these two options are turned on
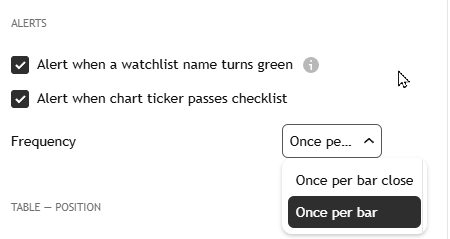
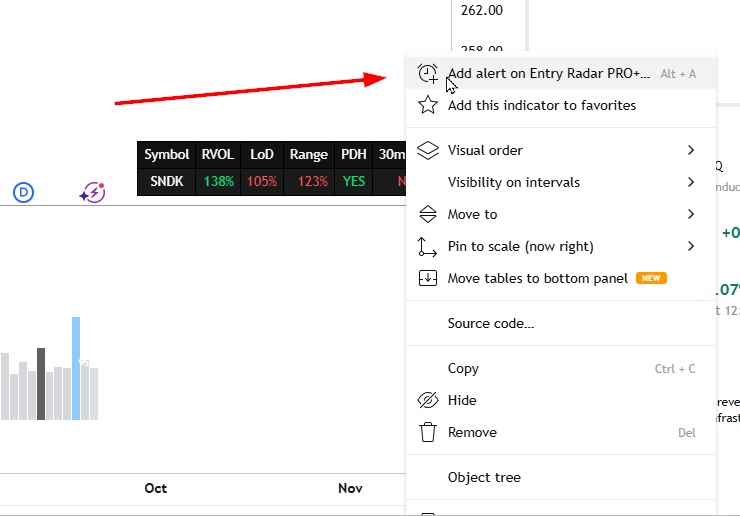
And now, all you have to do is right-click on the table
and select “Add alert on Entry Radar PRO+”
Next, make sure the time frame is set according to your ORB strategy, either 30-minute ORB or 5-minute ORB, otherwise, if it’s set to daily, you’ll receive an alert at the end of the day.
I recommend setting it to 5 minutes.
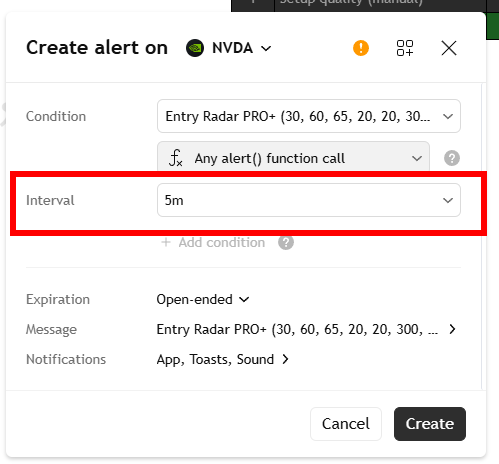
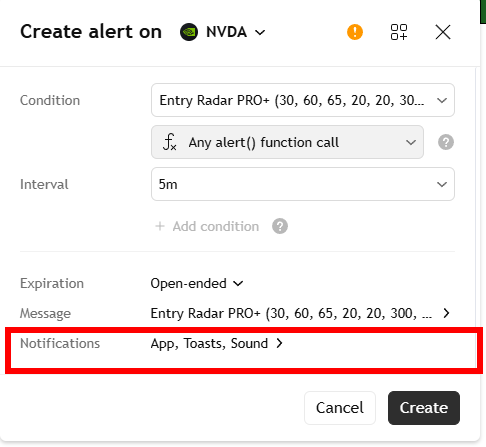
Then select “Create” to set up the alert.
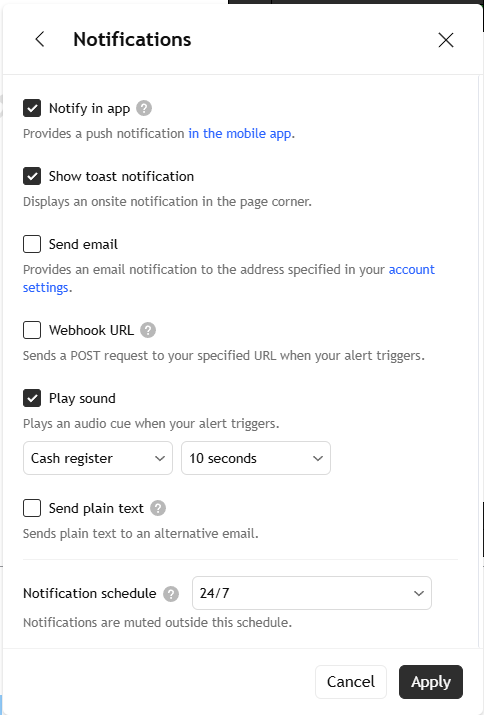
You can also customize where you want to receive the alert, either by email, directly on TradingView, or even as a text message on your phone.
If you select “Notifications”:
Below, select where you want to receive the alert and the time range.
So you don’t have to check every second to see what your favorite ticker is doing.
This indicator simply sends you an alert when all conditions are met.
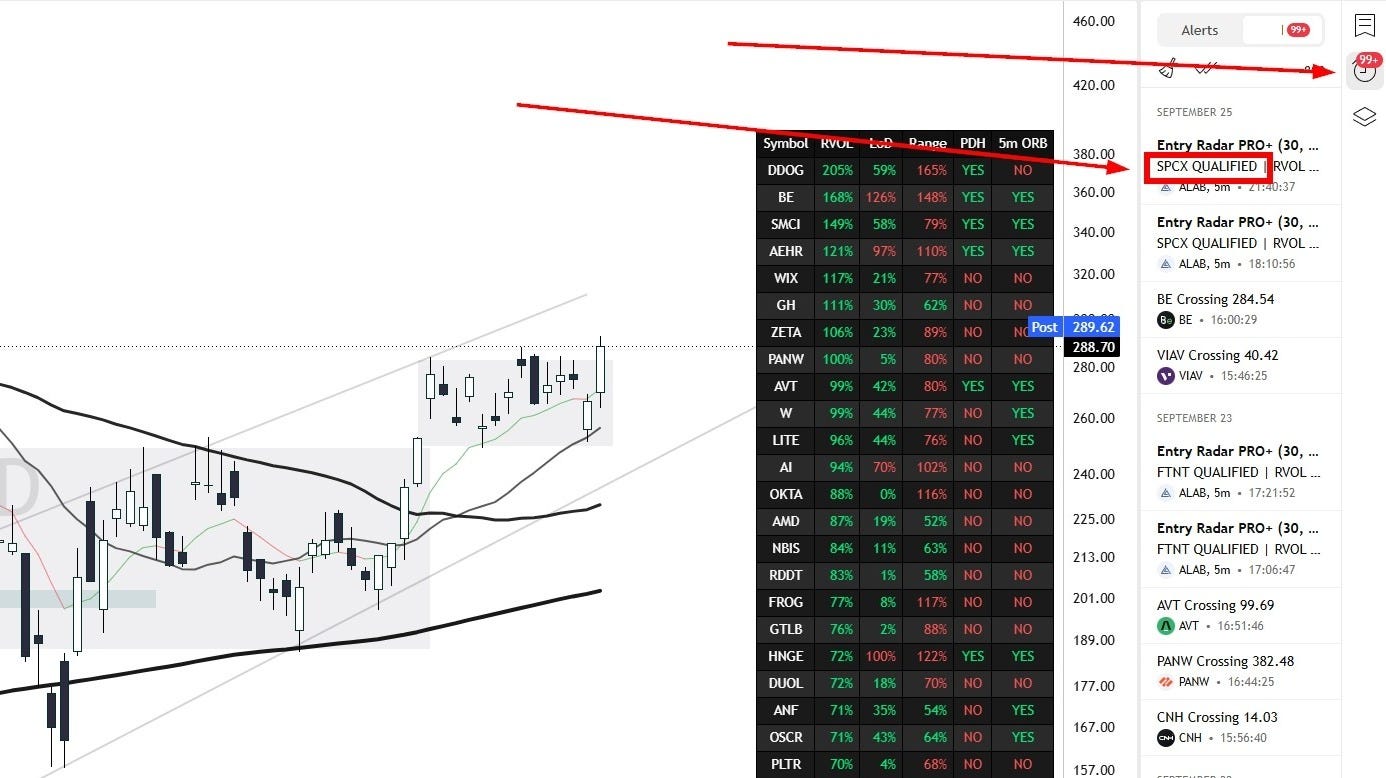
Entry Radar Criteria Explained
RVOL > 30% in the first 120 minutes from the open:
Volume is an important factor. Volume is generally the edge that trading stocks offers you. The reason I switched from trading futures (which is what I did early in my career, when I was still a break-even trader) is because those markets are incredibly efficient..there’s little edge to be found.
You’ll see that most unprofitable traders and scammers are in the Forex/Futures industry.
The reason most traders are profitable in stocks is because institutions (the big money, those who move the market) leave footprints.
It’s impossible to build a large position without triggering that big volume candle. Now, of course, high volume doesn’t always mean accumulation, it can also mean distribution, which is why it’s important to combine it with price action. O
f course, there will be times when a stock moves without volume, but more often than not, this will be a fakeout.
So, to cut a long story short, yes, you need to check the RVOL criteria; you want to see that RVOL above 30% as soon as possible, the more time that passes, the more likely it is to be a normal day.
If RVOL is around 50% by the end of the day, the chances of this being a breakout day are minimal, you understand? I also want you to understand that everything I teach here, and in general, are things you need to take, as the Americans say, “with a grain of salt.”
Nothing in trading is set in stone...there are many nuances. And what we’re trying to do is stack different edges in such a way as to maximize our probability of having a winning trade.
LoD < 60% of ATR
LoD is how far the price has already traveled off today’s low, measured against a normal day. ATR is the average daily range over the last 14 days, so 100% means “about one full normal day of movement.” If LoD is 30%, the stock is still close to the low. If LoD is 80%, it has already run most of a normal day off that low, and you are late.
I want this under 60% because the entry has to have room. Your risk on these trades is usually defined by the low of the day. The closer you are to that low, the smaller the risk and the more room the stock still has to work. Once you are 60% or more of ATR above the low, you are paying up for a move that already happened. The stop is far, the reward is whatever is left, and that is a bad trade even if the stock keeps going.
Same idea as RVOL and time. Early, LoD should be small. If by 10:30 the stock is already 70–80% off the low, the easy part is gone. You do not “catch up” by chasing it. You wait for the next one.
And again, 60 is not a law. Some of the best days push through it and never come back. The point of the filter is to keep you from making that the habit.
Daily range < 65% of ATR
Range is the whole day so far, high to low, against that same ATR. LoD tells you where you are inside the day. Range tells you how much of the day has already been used.
A stock can be near the low and still have a huge range, if it spiked and came all the way back. That is not the same thing as a tight, controlled open. If the high-to-low is already 65% or more of a normal day, a lot of the fuel is burned. Buying there means you are often buying the middle or the end of the move, not the start.
I want both. LoD under 60 so I am not extended off the low. Range under 65 so the day itself is not already stretched. When both are true and RVOL is already above 30% in the first couple of hours, you have volume and you still have room. That is the combination.
If the range is already near a full ATR by lunch, treat it like the late RVOL example. It can still trend, but the odds that you are early are much lower.
PDH previous day high
PDH is simply: did today’s price clear yesterday’s high? YES or NO.
Yesterday’s high is a real level. Everyone can see it. A lot of stock that “looks strong” is just bouncing inside yesterday’s range. That is noise. When price takes out the prior day’s high, the stock has left that range. That is the footprint. Someone is willing to pay above a level that held yesterday.
One nuance: a wick through yesterday’s high and an immediate failure is still a break on the table, and it can be a trap. YES means the level was cleared. It does not mean it is going to hold. That is why it sits next to the other filters and next to the actual price action, not instead of them.
ORB opening range break
The opening range is the high of the first part of the regular session. On the radar that is either the first 5 minutes (9:30–9:35) or the first 30 minutes (9:30–10:00). YES means price is above that high.
The open is where the first real fight happens. The 5-minute version is faster and it fails more often, because the first five minutes are full of noise. The 30-minute version lets that fight settle. If buyers still cannot get above the opening high after half an hour, I do not need to be in it. If they do, the open resolved up, and that is the direction I want.
This is the same stacking idea. ORB without RVOL is often a fakeout, exactly like a move with no volume. ORB with RVOL, a fresh PDH, and LoD and range still inside those limits is a stock that broke the open, broke yesterday, showed size, and is not extended. That is as much of an edge as this screen is meant to give you.
FAQ
The ticker I’m watching with Entry Radar broke above the 5-minute ORB or 30-minute ORB, but now it shows “no.” Why?
The tool calculates price in real time. If the other four criteria are valid but the price is below the 5-minute ORB, it will no longer show as valid. This helps protect you from fakeouts.
The stock has earnings in 4 days, but the tool says I can enter. What should I do?
As a general rule, avoid stocks with fewer than 5 days until earnings. The reason is simple: you won’t have enough time to build a cushion before the report. Of course, there are exceptions with fast movers that have very high average daily range percentages.
I added a penny stock to my list and Entry Radar says it’s time to enter. What should I do?
Avoid it. We do not trade penny stocks. The tool is meant to be used only for tickers that meet the stock-selection criteria.
Does Entry Radar scan for setups or patterns?
No. You still need to scan for setups yourself. There is no tool at the moment that can scan for setups with high accuracy. Entry Radar scans for five filters that improve your win rate and reduce overtrading:
RVOL
LOD <% ATR
Daily range < % ATR
Previous Daily High
5 ORB or/and 30 ORB
Trade Setups of The Week
High Probability Trades for 28 September - 2 October 2026

Inside this issue, you’ll find 7 high-probability trades with their charts, and next to each ticker, you’ll find the exact type of setup I’m watching.
To see exactly when I buy and what I sell in real time, join the private Discord server. (*available only to PRO members)
In addition, you’ll find 8 other tickers showing the setups they’re forming, though they still need some time before our entry signal is triggered, nevertheless, you should add them to your watchlist.
If you think this newsletter could help your friends, share it with them so it can reach as many traders as possible.
And here’s the fun part: when you share it, you can unlock special rewards + you will look smart in front of your friends :)
“One trade closer to freedom.”
Vladislav