

My selling price for Bitcoin (BTC)
Why I Won’t Sell Until...

Let’s be real—I’m here for the money. I didn’t get into Bitcoin because of some ideological crusade against banks or a dream of decentralization. I got in because I saw an opportunity to make life-changing gains. But along the way, I realized something: making money with Bitcoin isn’t just about stacking numbers on a screen—it’s about buying freedom. Unlike banks, no one can freeze my funds. (i keep them in a cold wallet). Unlike traditional finance, I don’t need permission to move my money. So yeah, I came for the money—but I’m staying for the power that comes with it.
Everyone has a selling price. Even the biggest Bitcoin maxis will eventually cash out, whether they admit it or not. The question is: When?
Here’s my honest answer to that.

My Price Target(s): What It Would Take for Me to Sell
I want to start by saying that:
No one knows how high BTC will go.
However, we can look at some indicators. The first one I like to look at is the USDT.D chart.
USDT.D represents the dominance of Tether (USDT) in the crypto market, meaning the percentage of the total crypto market capitalization that is held in USDT. On TradingView, this indicator is expressed as a percentage and shows us how much money is in stablecoins compared to volatile cryptocurrencies.
In short:
If USDT.D increases, it means investors are moving their money into USDT and exiting Bitcoin and other cryptocurrencies → Bearish for BTC.
If USDT.D decreases, it means investors are leaving USDT and buying Bitcoin and other altcoins → Bullish for BTC.
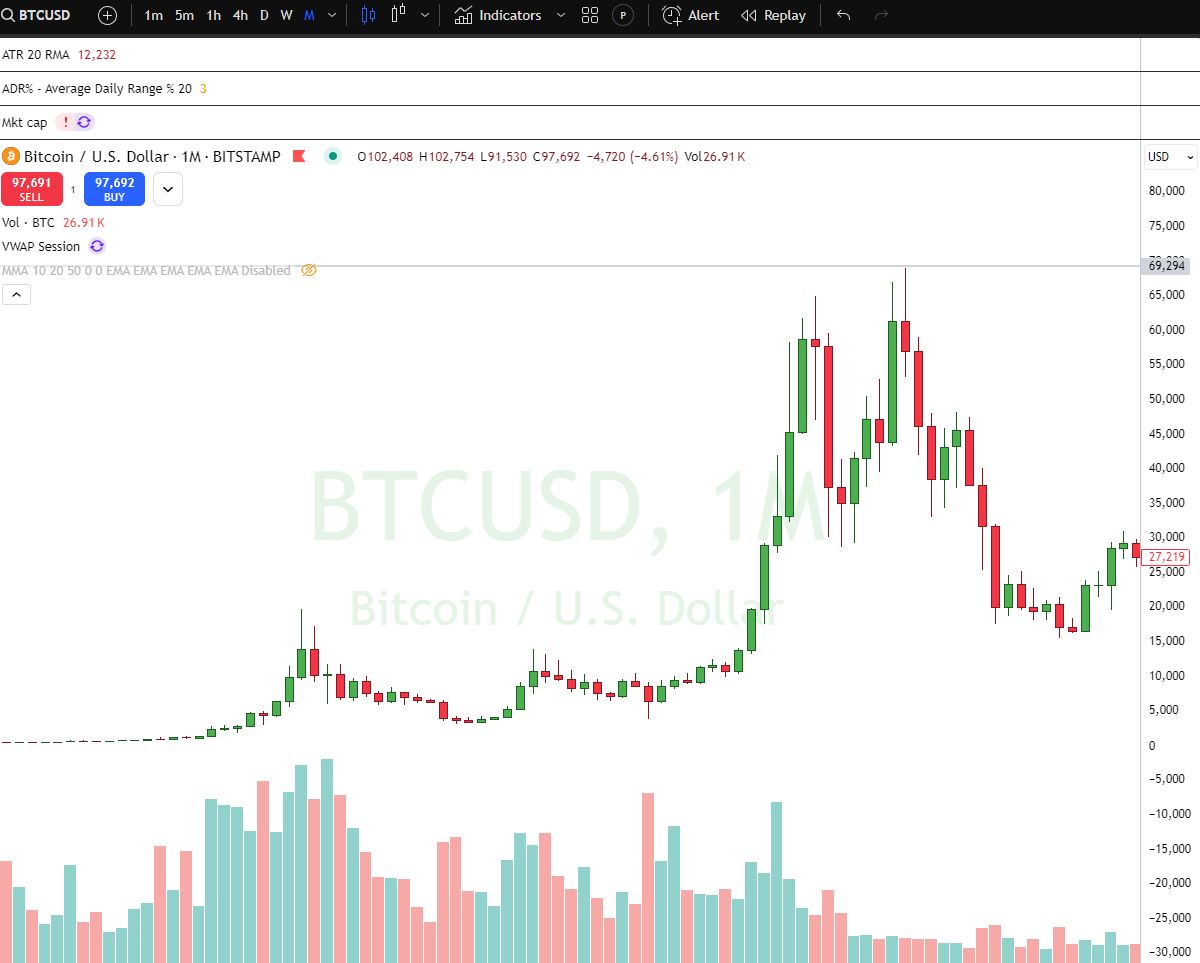
And if we look back at 2021, during the last bull run (when BTC reached $69,294):
And then we take this chart and compare it with the USDT.D dominance, which looks like this:
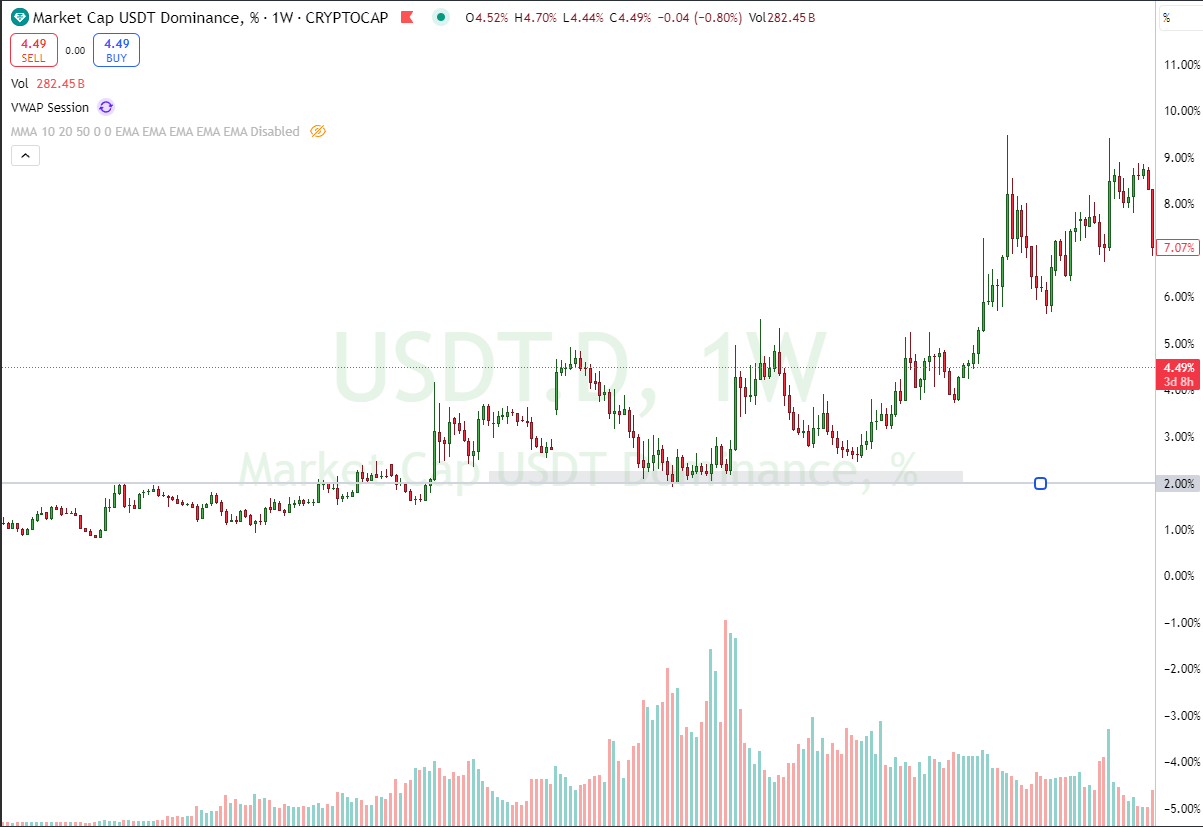
Do you notice that there is an inverse correlation between the amount of USDT in the market and the price of BTC?
Now, let's look at the current state of USDT.D:
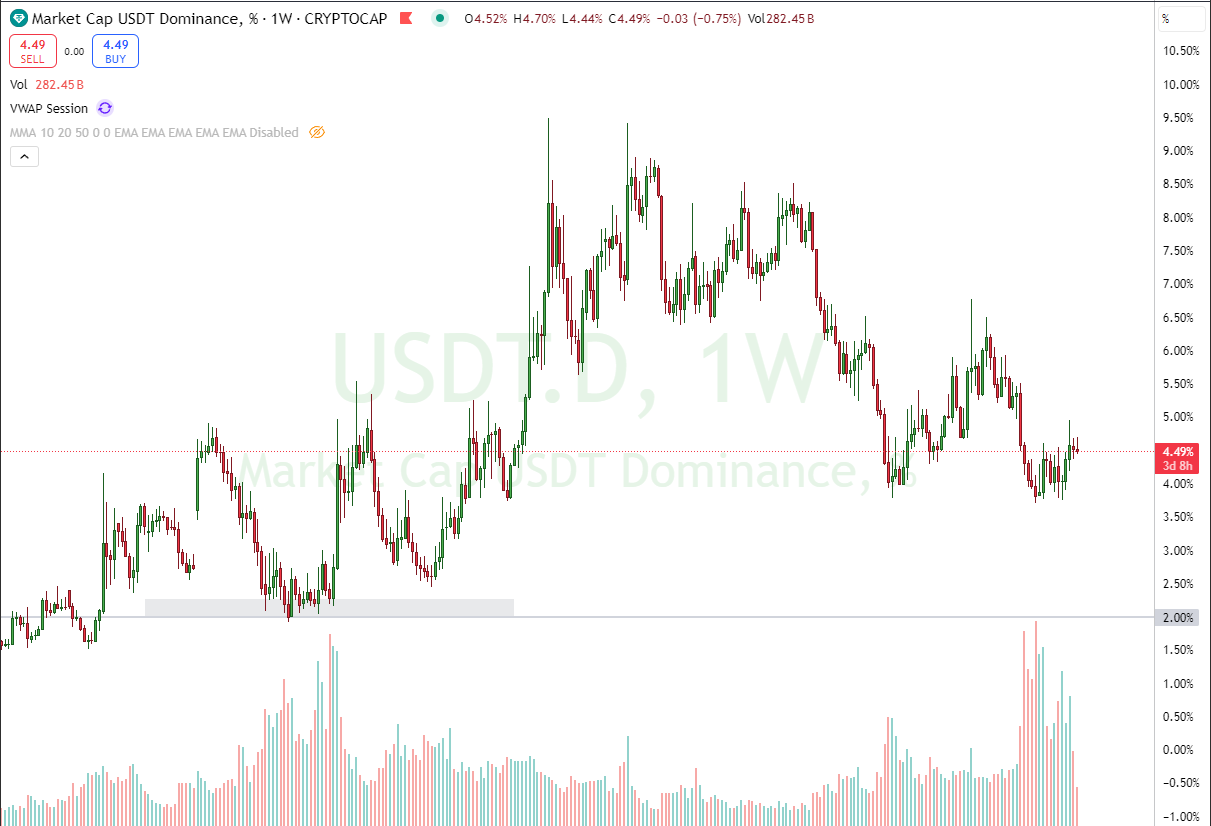
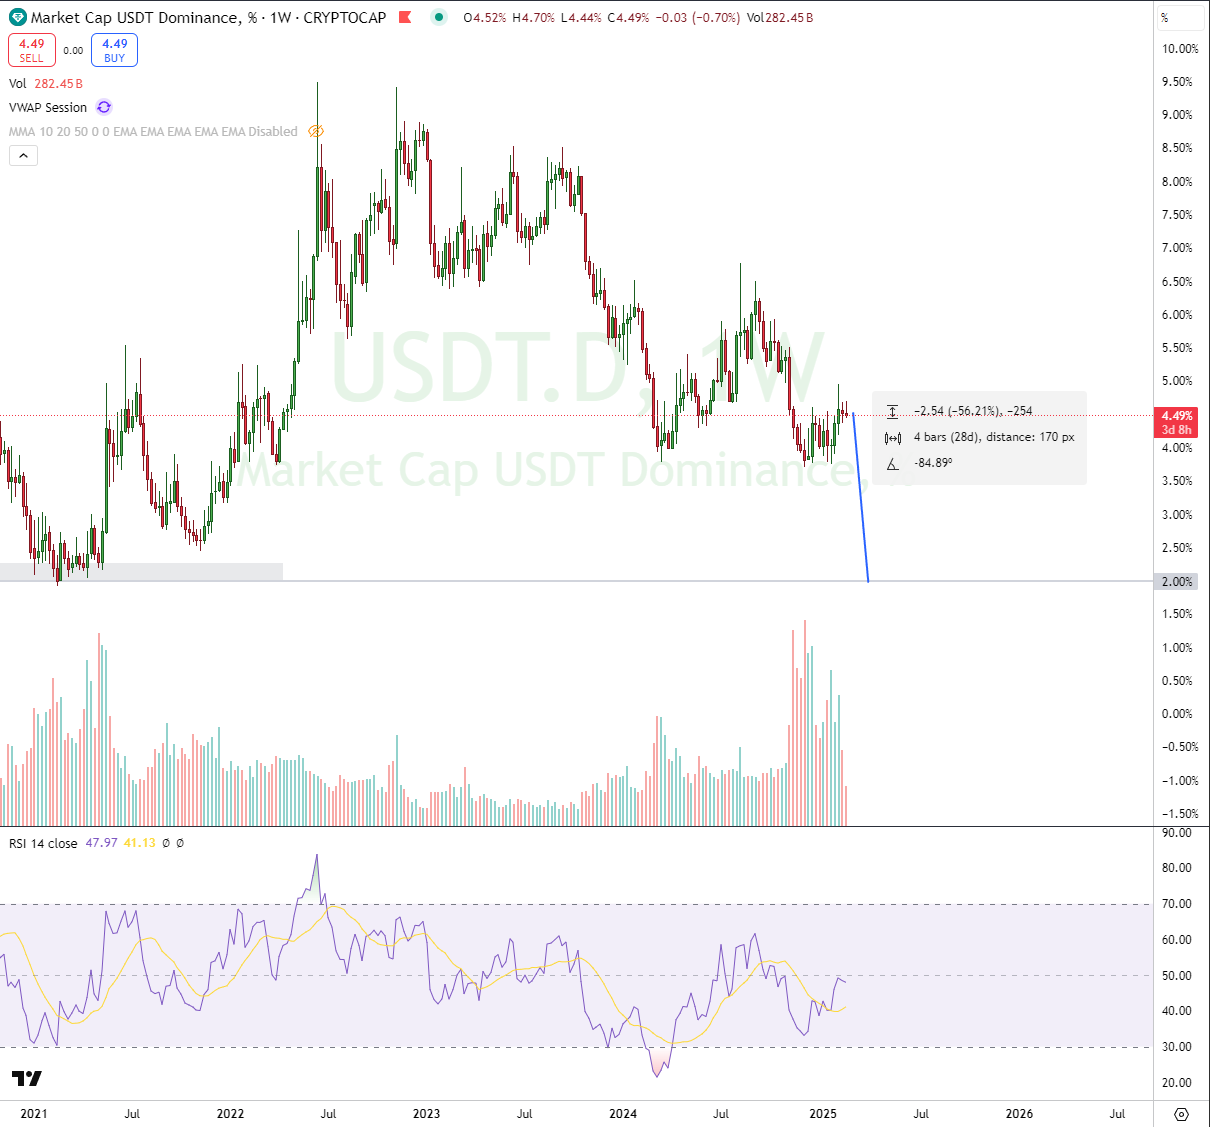
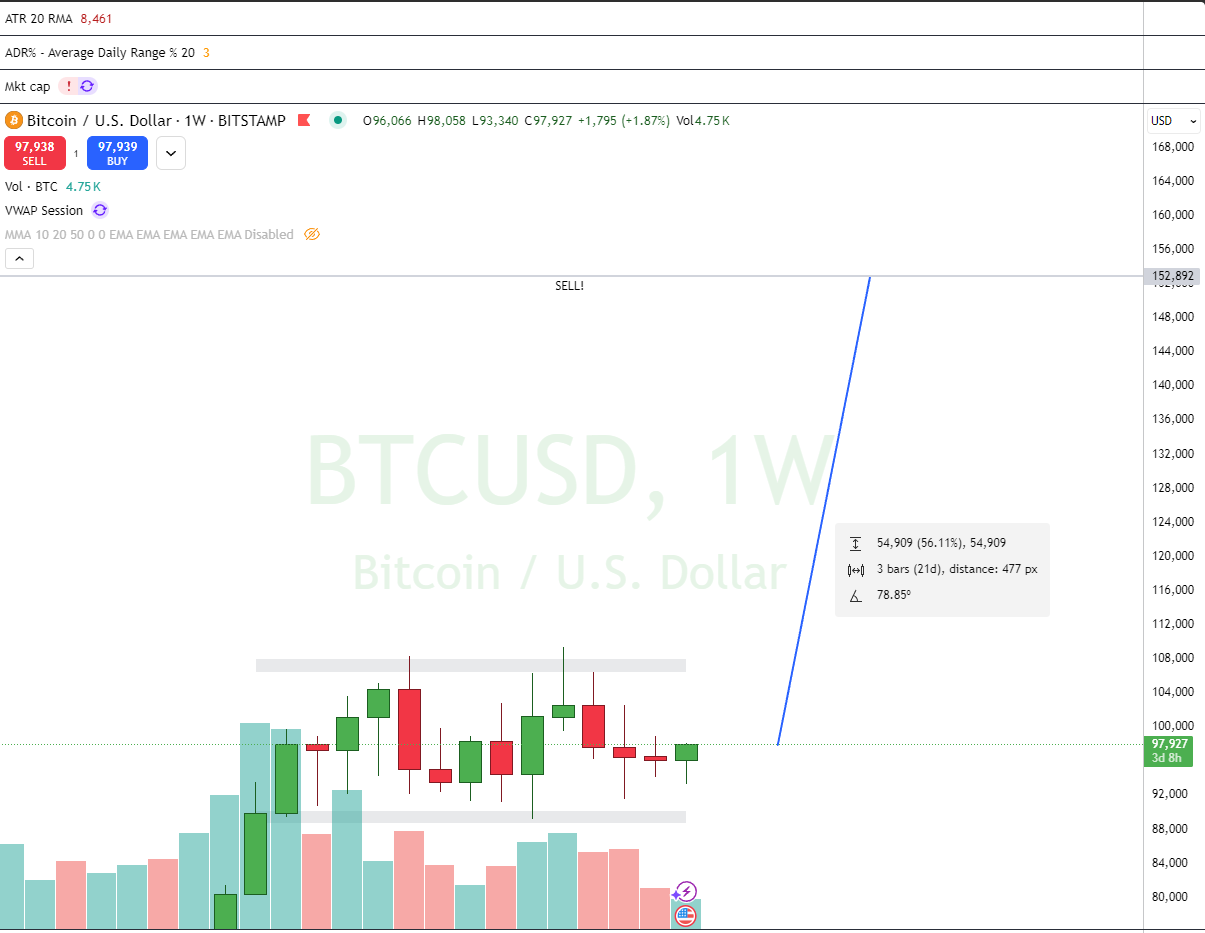
It is currently at 4.49%. And if USDT.D were to drop to 2.00% (as it was in the last bull run), that would mean a 56% decrease.
If we also add the RSI indicator, we can see that there is still room for a further decline before we compare it to the 2021 levels.
If we calculate this increase for BTC, we could estimate that in this cycle, the top for BTC would be at $152,000.
And if we add an RSI to this chart on the monthly timeframe, we can observe that at the last top, the RSI level was at 91, while now it is at 76.
This suggests that there is still room for growth.
Of course, I advise you to set multiple targets where you sell gradually over time. There is no special moment when everyone sells at a profit.
If it were that easy, everyone would do it, and we would all be in profit.
But unfortunately, that’s not how the market works.
I will start taking profits at $120,000, $130,000, $140,000, $150,000, and I will probably keep small amounts, like 0.10 BTC, until the end of the cycle.
Of course, this is not the only chart or analysis I rely on, but all calculations point to a range of $120K - $190K per BTC.
We'll see what Bitcoin does by the end of the year.
Why I’m Not Selling Yet
People sell Bitcoin for all sorts of reasons—fear, greed, or short-term profit-taking. But I see Bitcoin as a long-term asset. The volatility is irrelevant when you’re playing the long game.
Right now, we are still early in the Bitcoin adoption cycle. Institutions are still accumulating. Governments are still figuring out how to regulate it. The mainstream media still calls it a bubble. To me, that means there’s still upside left.
So no, I’m not selling. Not yet.
But when I do, it’ll be on my terms.
At what level do you believe Bitcoin will reach in this cycle? Drop your thoughts in the comments! 👇