


This is the current value of my swing trading account.
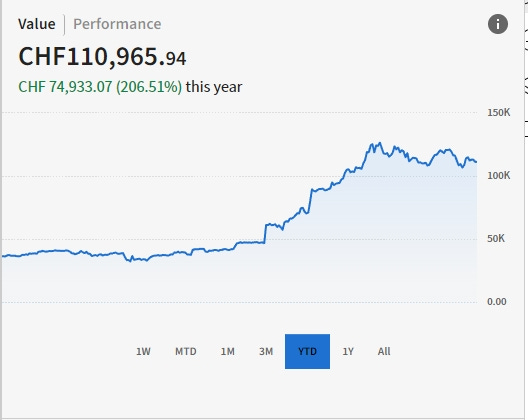
Attention: since I live in Switzerland, the currency is set in CHF (which means if you convert it to USD, the amount is higher).
To better understand the strategy we are following and not to buy blindly without any context, please read and analyze my strategy carefully:

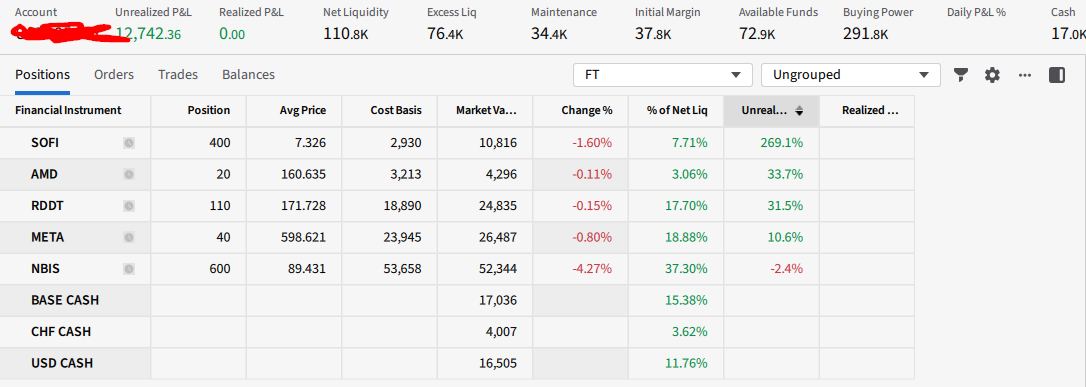
Right now, these are my positions:
Weekly Market Direction
Dear traders,
I’m happy to share the last report of the year. After 23 consecutive reports, you’ve come to expect a high standard and a discipline we’ve maintained week after week.
So for next year, I promise the same consistency you’re used to: clear analysis, a simple plan to follow, a focus on high-probability setups, and most importantly, risk management.
In 2026, the goal isn’t just to make money. The goal is to become better: calmer, more consistent, more professional. Profit is the side effect of doing the process right.
So without too much introduction, let’s get into this report.
We just closed a holiday-shortened, low-liquidity week… and the market still pushed to new highs.
The S&P 500 and Dow printed fresh record closes while volumes stayed light.
Let’s see what our weekly market direction is telling us.
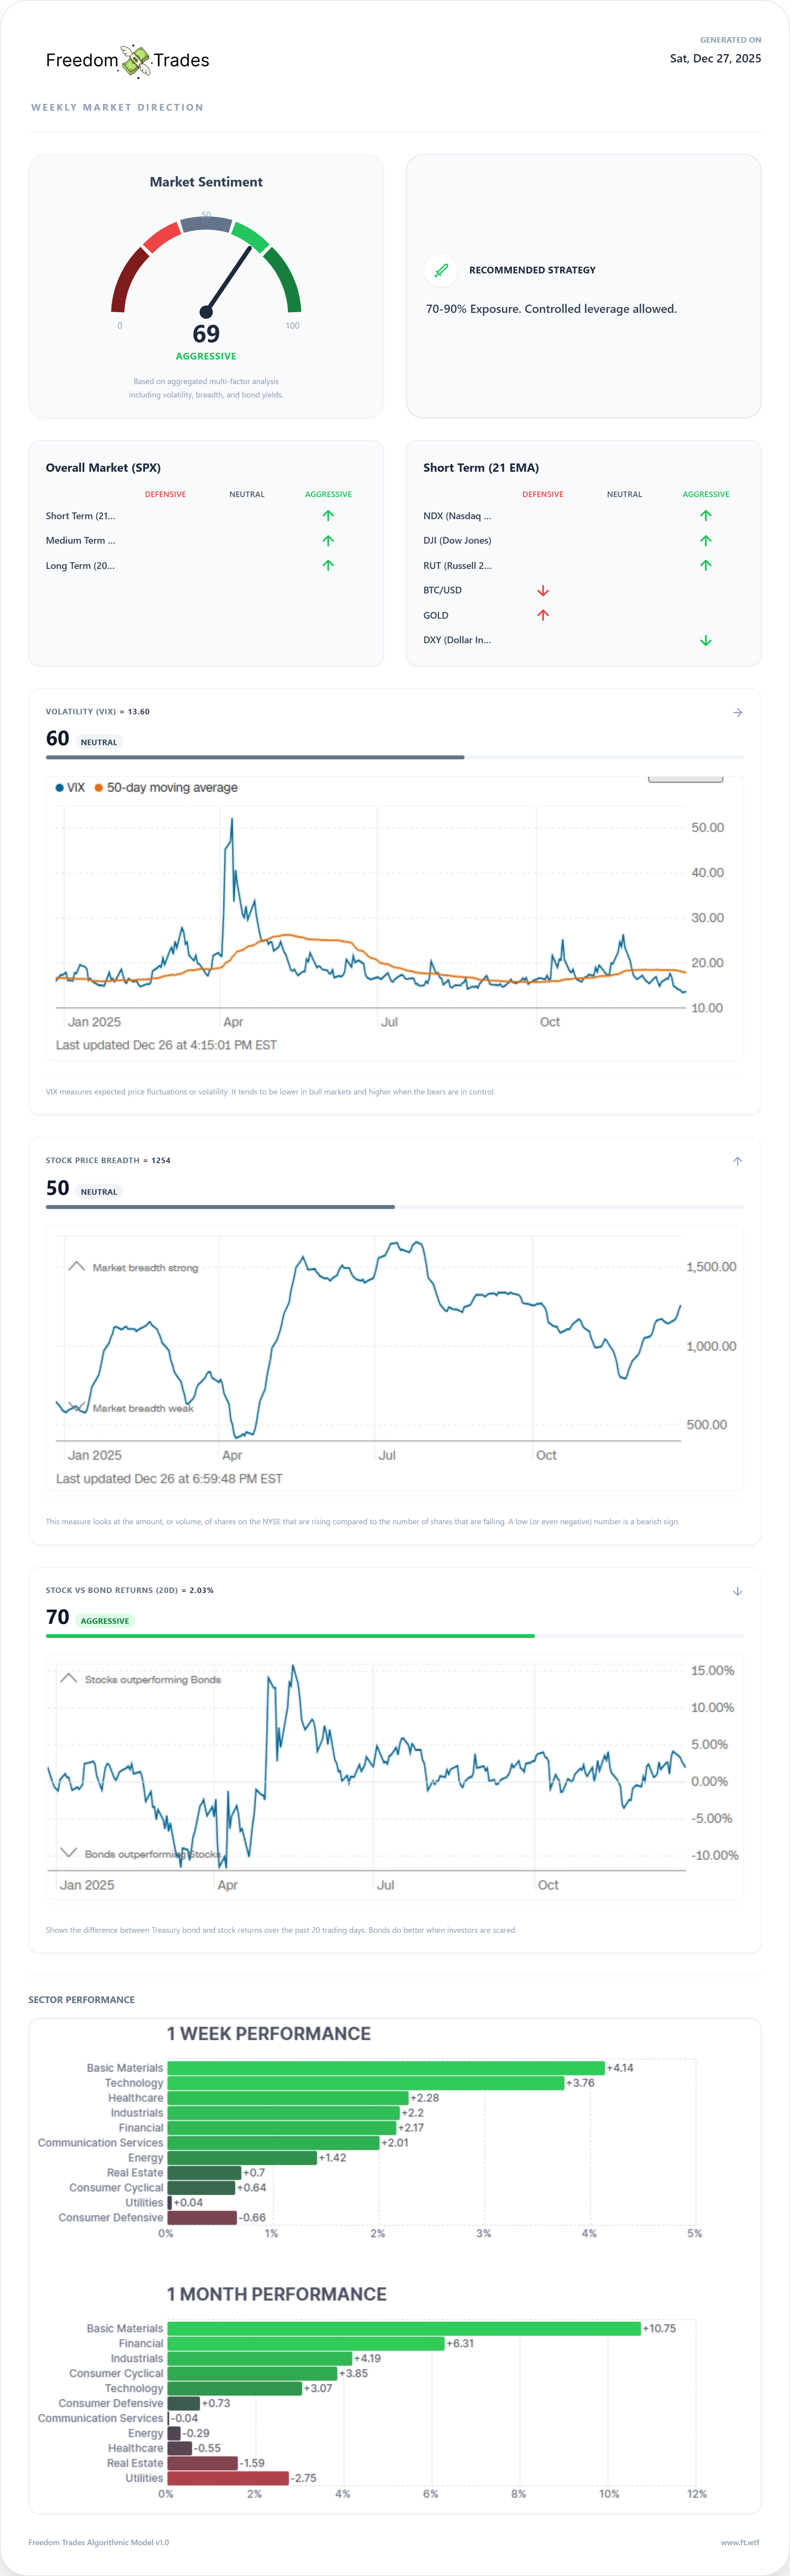
The model is telling us to stay in offense, but stay professional about entries, sizing, and stops.
What the market did this year
Weekly and yearly performance:
DJIA: 48,710.97 (+1.2% week; +14.5% YTD)
S&P 500: 6,929.94 (+1.4% week; +17.8% YTD)
Nasdaq: 23,593.10 (+1.2% week; +22.2% YTD)
Russell 2000: basically flat on the week (+0.19%, +13% YTD)
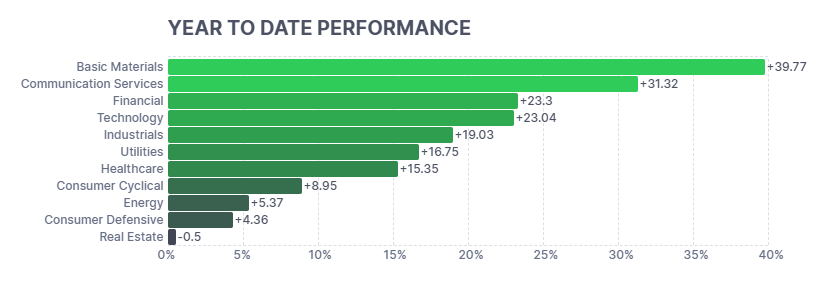
Year-to-Date Performance grouped by Sector:
Also notable:
Gold and silver surged
Treasuries gained modestly as yields drifted slightly lower in thin holiday liquidity (10-year stayed mostly range-bound around 4.1%–4.2%, ending near 4.13%)
I also find this chart interesting, and I want to share it with you.
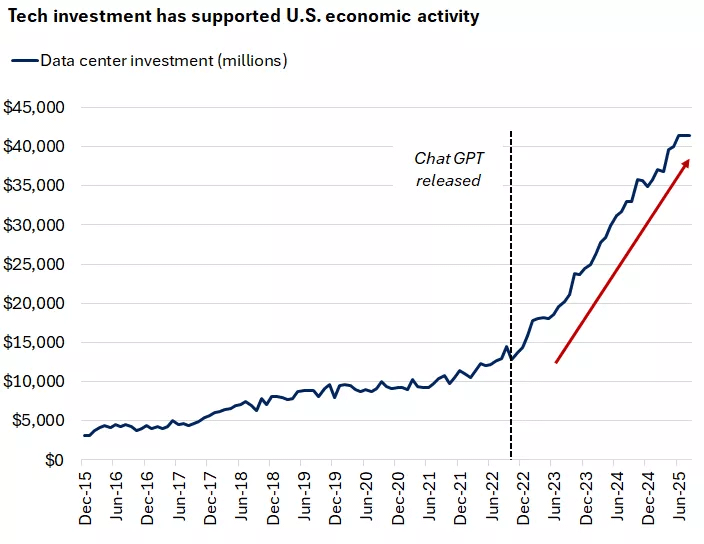
I believe AI has the potential to remain a key driver of economic growth in 2026. That’s why, as you already know, I have a considerable position in NBIS, and I’ll be closely tracking the trends that are likely to emerge in AI next year.
That capex is real money being deployed into infrastructure, and it’s one of the reasons tech/communication services stayed dominant in 2025.
How I’m approaching next week:
Stay aligned with the uptrend
Keep exposure high, but risk controlled.
If you’re at the top end of exposure, you need tighter execution: cleaner entries, defined invalidation, and no “hope trades.”
Respect what’s leading.
High Probability Trades
Although I’m advising you not to open new positions and to focus only on managing existing ones, as volume will most likely be thin and I don’t expect any huge moves during these last few days of the year.
Realistically, I’ll start again on January 5th, but that doesn’t mean we can’t prepare until then.
I also want to let you know that between December 30th and January 4th my activity will be lower (I probably won’t open any new positions.), as I’ll be traveling to Zurich to spend New Year’s Eve and then to Paris for a few days. (It’s a surprise for my wife, she doesn’t know yet. ^_^ )
These are some setups/charts that I find interesting for next week.
Ticker: CSIQ & FLNC
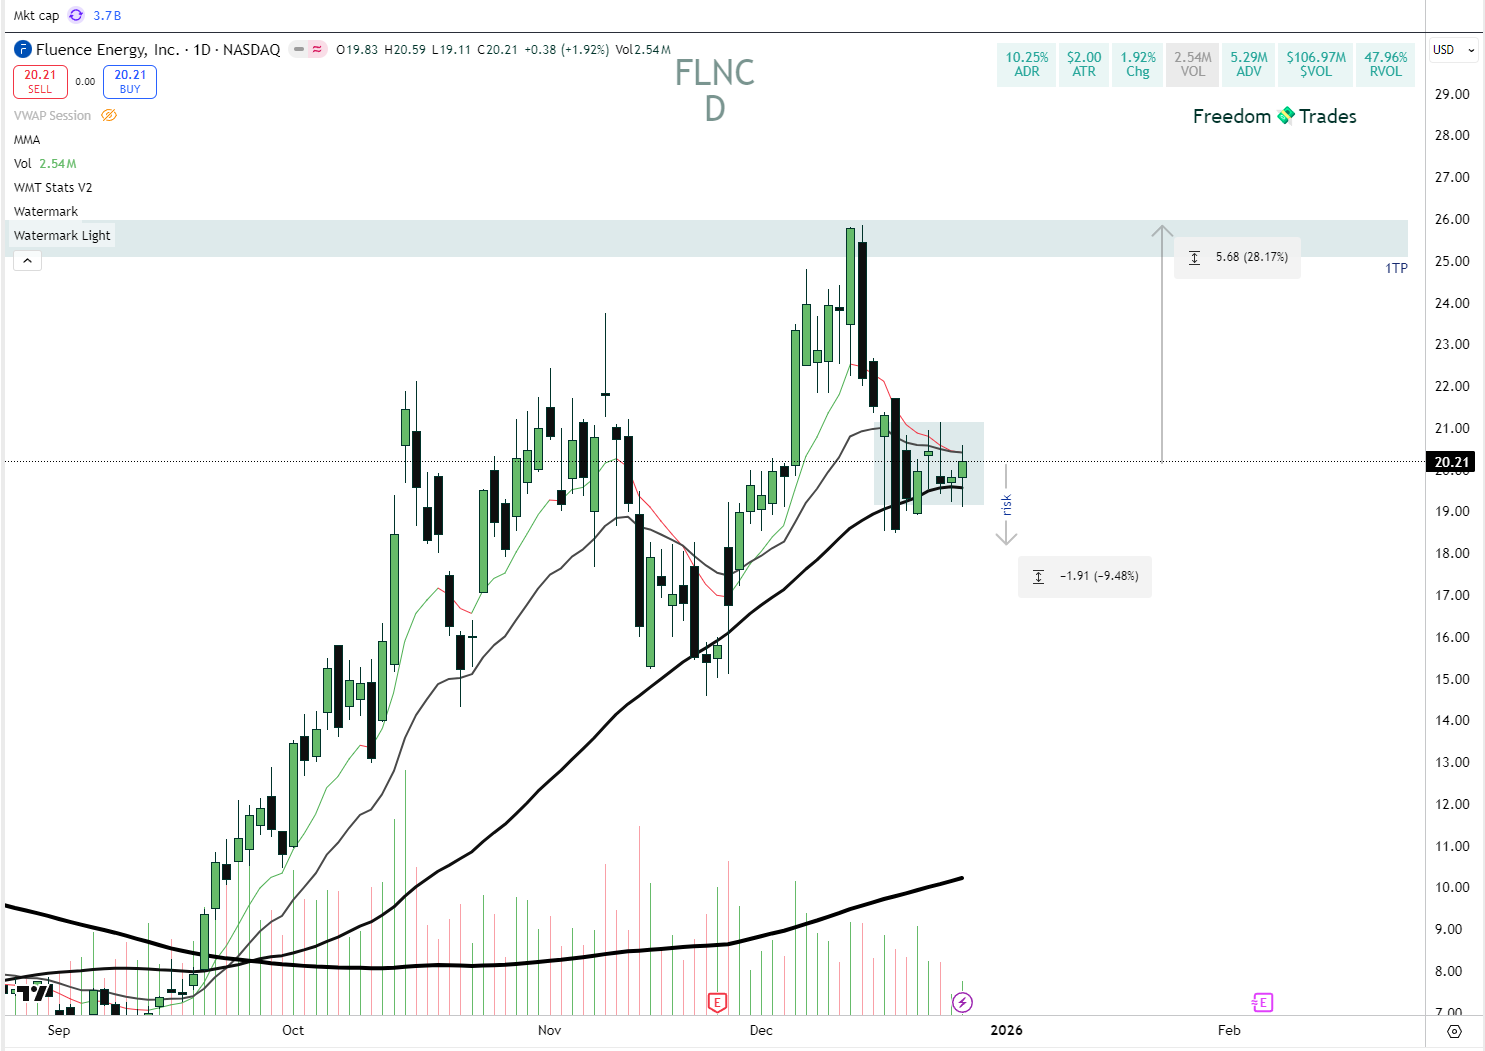
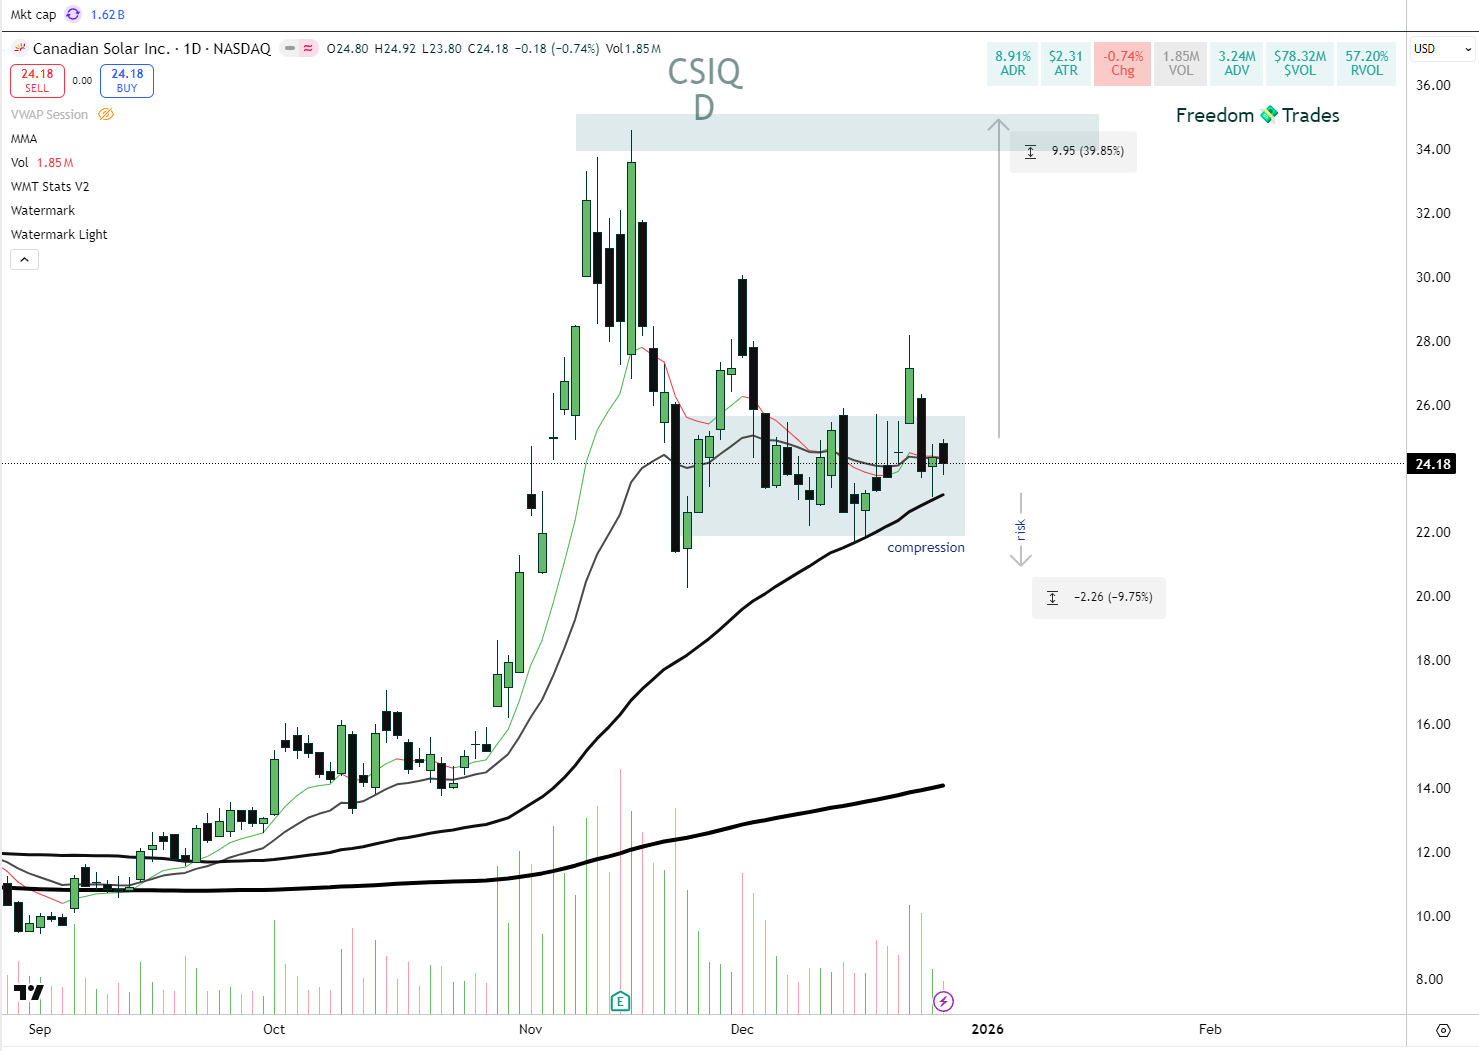
The reason I included both is that they all come from more or less the same sector(energy) and both showed relative strength on Friday compared to the high-beta market overall.
CSIQ and FLNC share the same pattern: price compression. Both are tagging the 50 SMA and sitting in a tight range over the last few days.
We can attempt a trade with relatively low risk by placing the stop loss below that lower base. First take profit should be at the previous top. In my opinion, FLNC has higher reward potential, but it’s also more volatile.
Other interesting tickers you should keep an eye on:
LYFT, KTOS , AVAV, UNH, IBIT, NIO, SNDK
Important links to read and understand:
🟢How to define whether a setup is A+, A, or B. (Click here)
Context
Check the chart watermark to identify the analysis timeframe.
The gray/blue zone marks support and resistance.
The slim blue lines are trend lines
The moving averages used are 200 EMA, 50 EMA, 20 EMA, and 10 EMA.
The 200 EMA is the most important for trend direction.
The 10 EMA is used for exits, if you are in profit and the price closes below the 10 EMA on a daily close, exit the position. (wait for EOD before closing)
You are free to choose/decide when to take profits, but the most important is to place your stop loss at -10% (from entry price / avg price if you dont enter with full size).
For an A+ setup, you can extend it to -15%, but never let a position go beyond that.
Important: That 15% refers to your position size, not your total capital. You should never risk more than 3% of your total capital on any single trade.
I encourage you, if you’re already a PRO member, you can upgrade your membership on the Discord server (at no extra cost) and get access to a fully private server dedicated to PRO members, for networking, trade ideas, insights, and alerts.
Connect PRO account with discord server
P.S.: The email you use on Discord must be the same as the one on Substack.
All the positions I take during the week can be found on the Discord server or in the Freedom Trades private chat.
If you get an error or can’t make it work, message me privately, I might be able to help you out. 🙂
“One trade closer to freedom”
Vladislav