

Stock Stage Analysis: How to Spot the Next 2000% Winner
The 4 Stages of a Stock Stock by Stan Weinstein | Edition 51
Dear Traders,
The difference between a stock that yields 2000% returns like $SNDK and one that blows up your trading account, aka $PYPL, lies in exactly what stage that stock is in.
Today, I’m going to show you exactly how to identify potential stocks that can bring you triple-digit returns, and more importantly, how to stay away from the ones that lose you money.
And at the end, I'm going to give you a secret deal that I will make public for a limited time, only for the first 18 members.
The Four Stages of a Stock’s Price Cycle
A stage of a stock refers to one of four distinct, recurring phases in its price lifecycle: Accumulation, Markup, Distribution, and Markdown
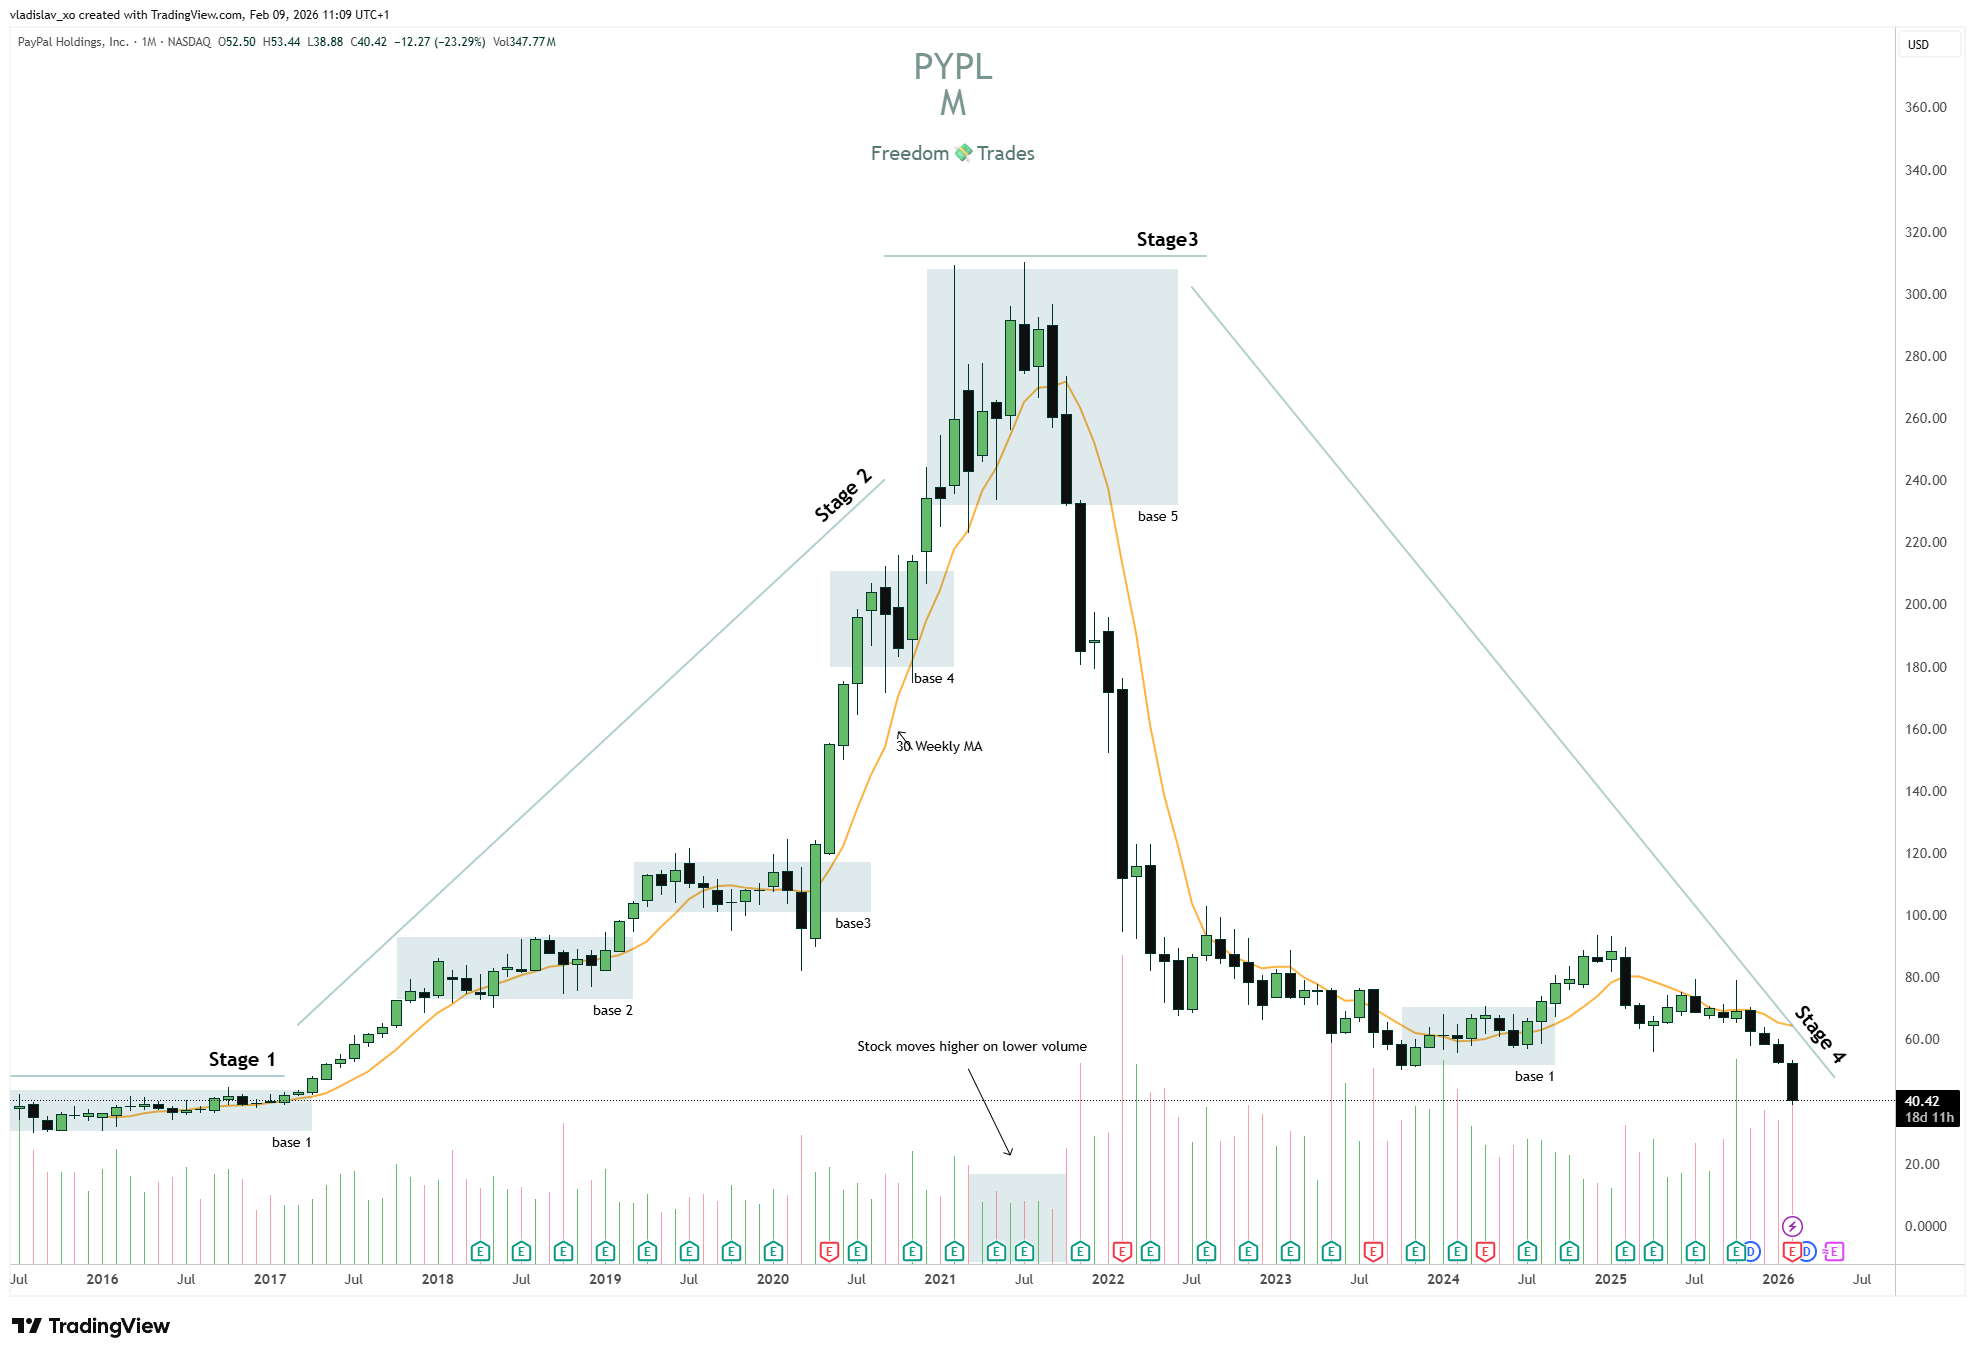
And I’m going to show you an example using the worst possible stock right now, namely $PYPL:
Now, let’s discuss each stage individually.
Stage 1 - Accumulation
The price action forms a horizontal base on the chart. This base can last weeks, months, or sometimes even years. The stock might be neglected, but “the bigger the base, the more explosive the move will be.”
A long base will form a much more significant support level. Most of these bases form after a correction, specifically, in a bear market.
Ironically, that is the moment when most traders give up. However, you should do the opposite; a bear market is the time to scan and do the most research. This is because the greatest opportunities are born in bear markets, stocks that will move 200%, 500%, or even 2000% in a bull market, just like $SNDK or $NVDA did.
So, here is what you should do:
Create a watchlist with Stage 1 stocks.
Set a price alert for the moment the stock exits that base.
Monitor for a volume spike as the stock price approaches the breakout zone.
Do not try to buy before the transition to Stage 2. These stocks can stay for months, even years, in Stage 4 or Stage 1 (check $PYPL if you don’t believe me). You don’t want to be stuck in a position for years on end.
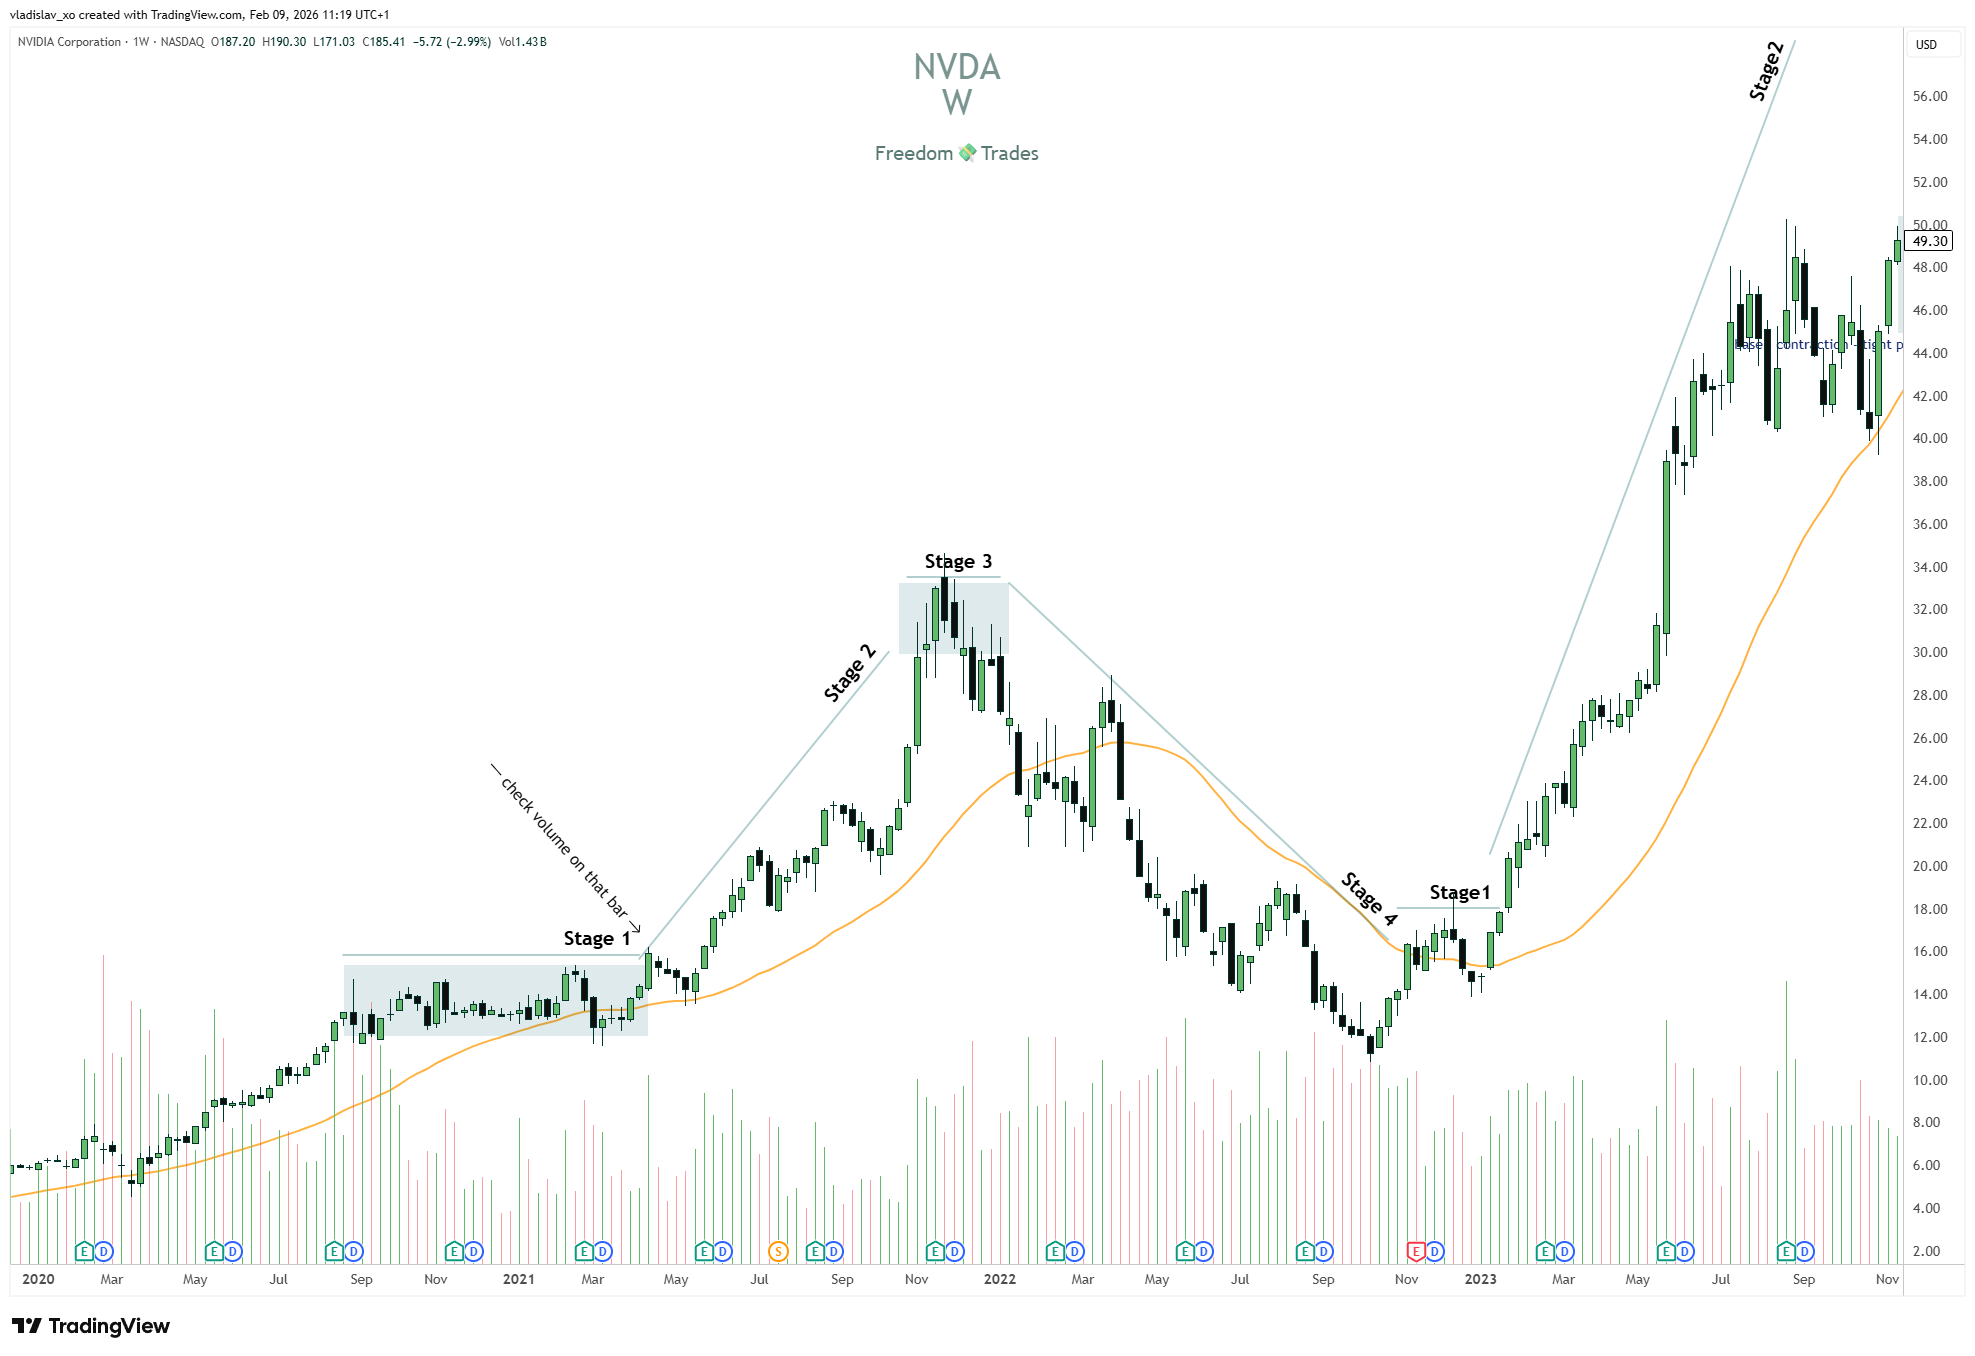
Here are some good examples: $NVDA (Weekly)
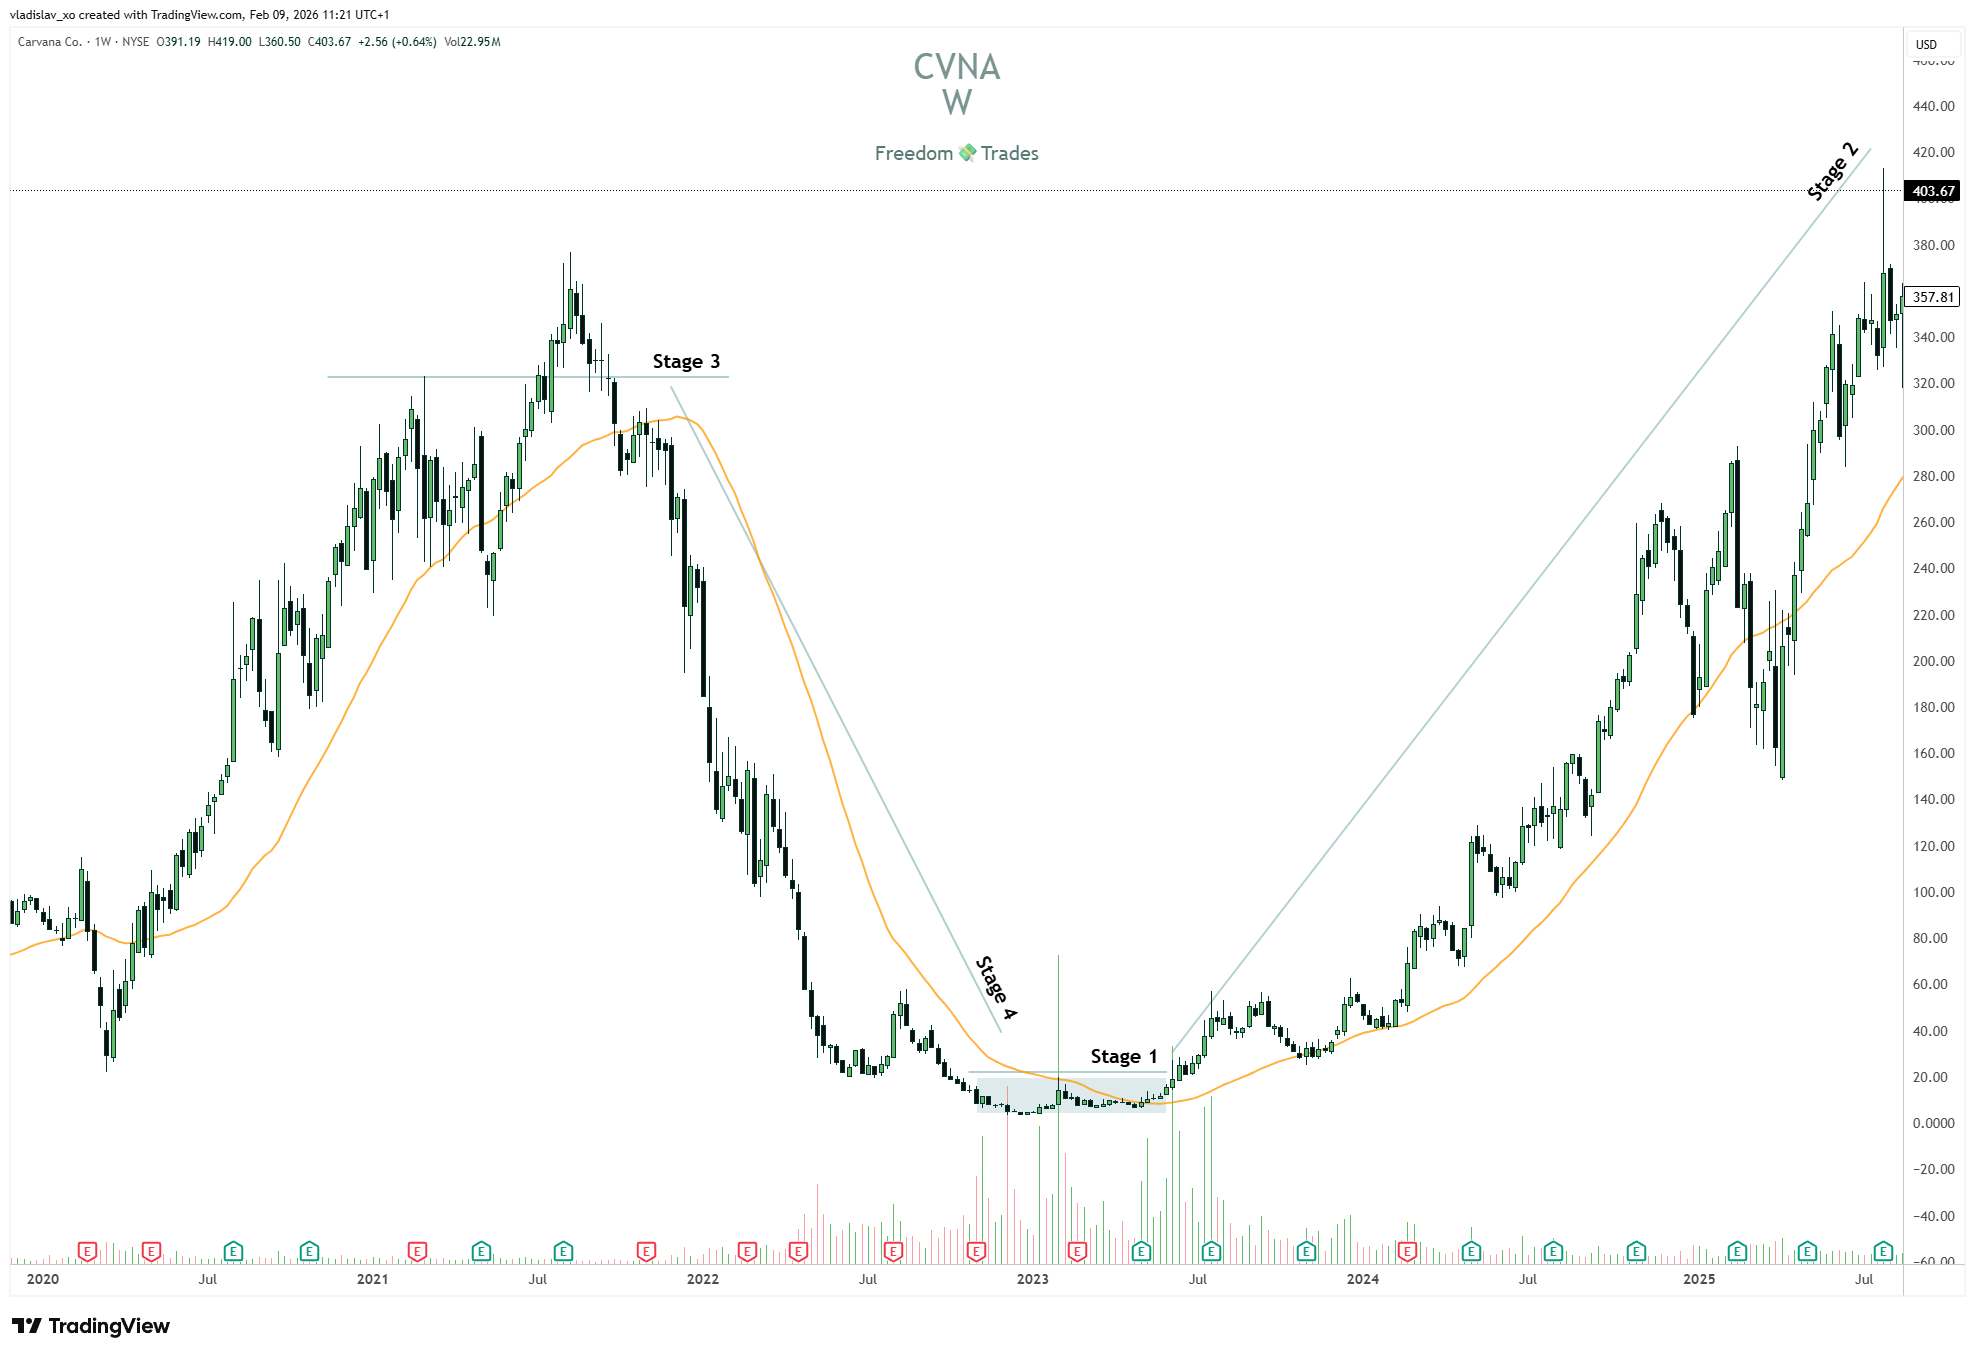
CVNA (weekly)
Stage 2 - Markup
The most important part of the system is recognizing a stock that is entering Stage 2. This is the phase where the stock begins its advance. It can be easily identified; it’s not that complicated.
Here are the signs I look for:
Increase in relative volume (on both weekly and daily bars).
Price breaks out of the base formed in Stage 1.
Price is above the 200 MA on the daily (ideally, above all moving averages: 200, 50, and 20 MA).
How does this stock become a high probability trade?
Analyzing the quality of a Stage 2 breakout is essential! The more qualities a stock possesses, the more it becomes a high-probability trade. Here are the most important factors that transform a stock into one capable of delivering 5x, 10x, or even 20x returns:
The General Market Trend
If we are in a bull market, your stock has a much higher chance of performing. Breakouts only work about 20% of the time in bear markets, so the probability of that stock performing a gap up and then fade is very high when you are in a bear market.
The Sector
It is essential to study the relative strength of a sector. If that stock belongs to a sector that is currently hyped and has a specific story or theme surrounding it, you will find a big winner.
For example: $TSLA from 2019 to 2021 (the big EV story).
Or $NVDA from 2023 to 2025 (the AI trade).
Volume
The breakout must occur with a massive surge in volume. At a minimum, look for 2x Rvol on the daily, but even more important is the weekly volume. It must demonstrate that the stock is being targeted by institutions, the only players who can truly drive the stock price higher. Volume shows that accumulation is happening and the stock is being bought by “big money.”
The Size of the Stage 1 Base
As mentioned before, the larger the Stage 1 base, the less resistance that stock will encounter.
Stage 3 - Distribution
Stage 3 is the most dangerous stage of a stock to be in, whether you are on the long side or the short side, because you will be chopped up by the price action.
The stock will tend to move sideways, and you will notice that the Moving Averages on the daily chart start to flatten (the same way they do in Stage 1).
At this point, it is very important not to confuse a Stage 3 top with just another base leg or a consolidation before a potential breakout back into a Stage 2 advance. Therefore, do not start shorting it before the actual move occurs.
If we look at $PYPL again as an example:
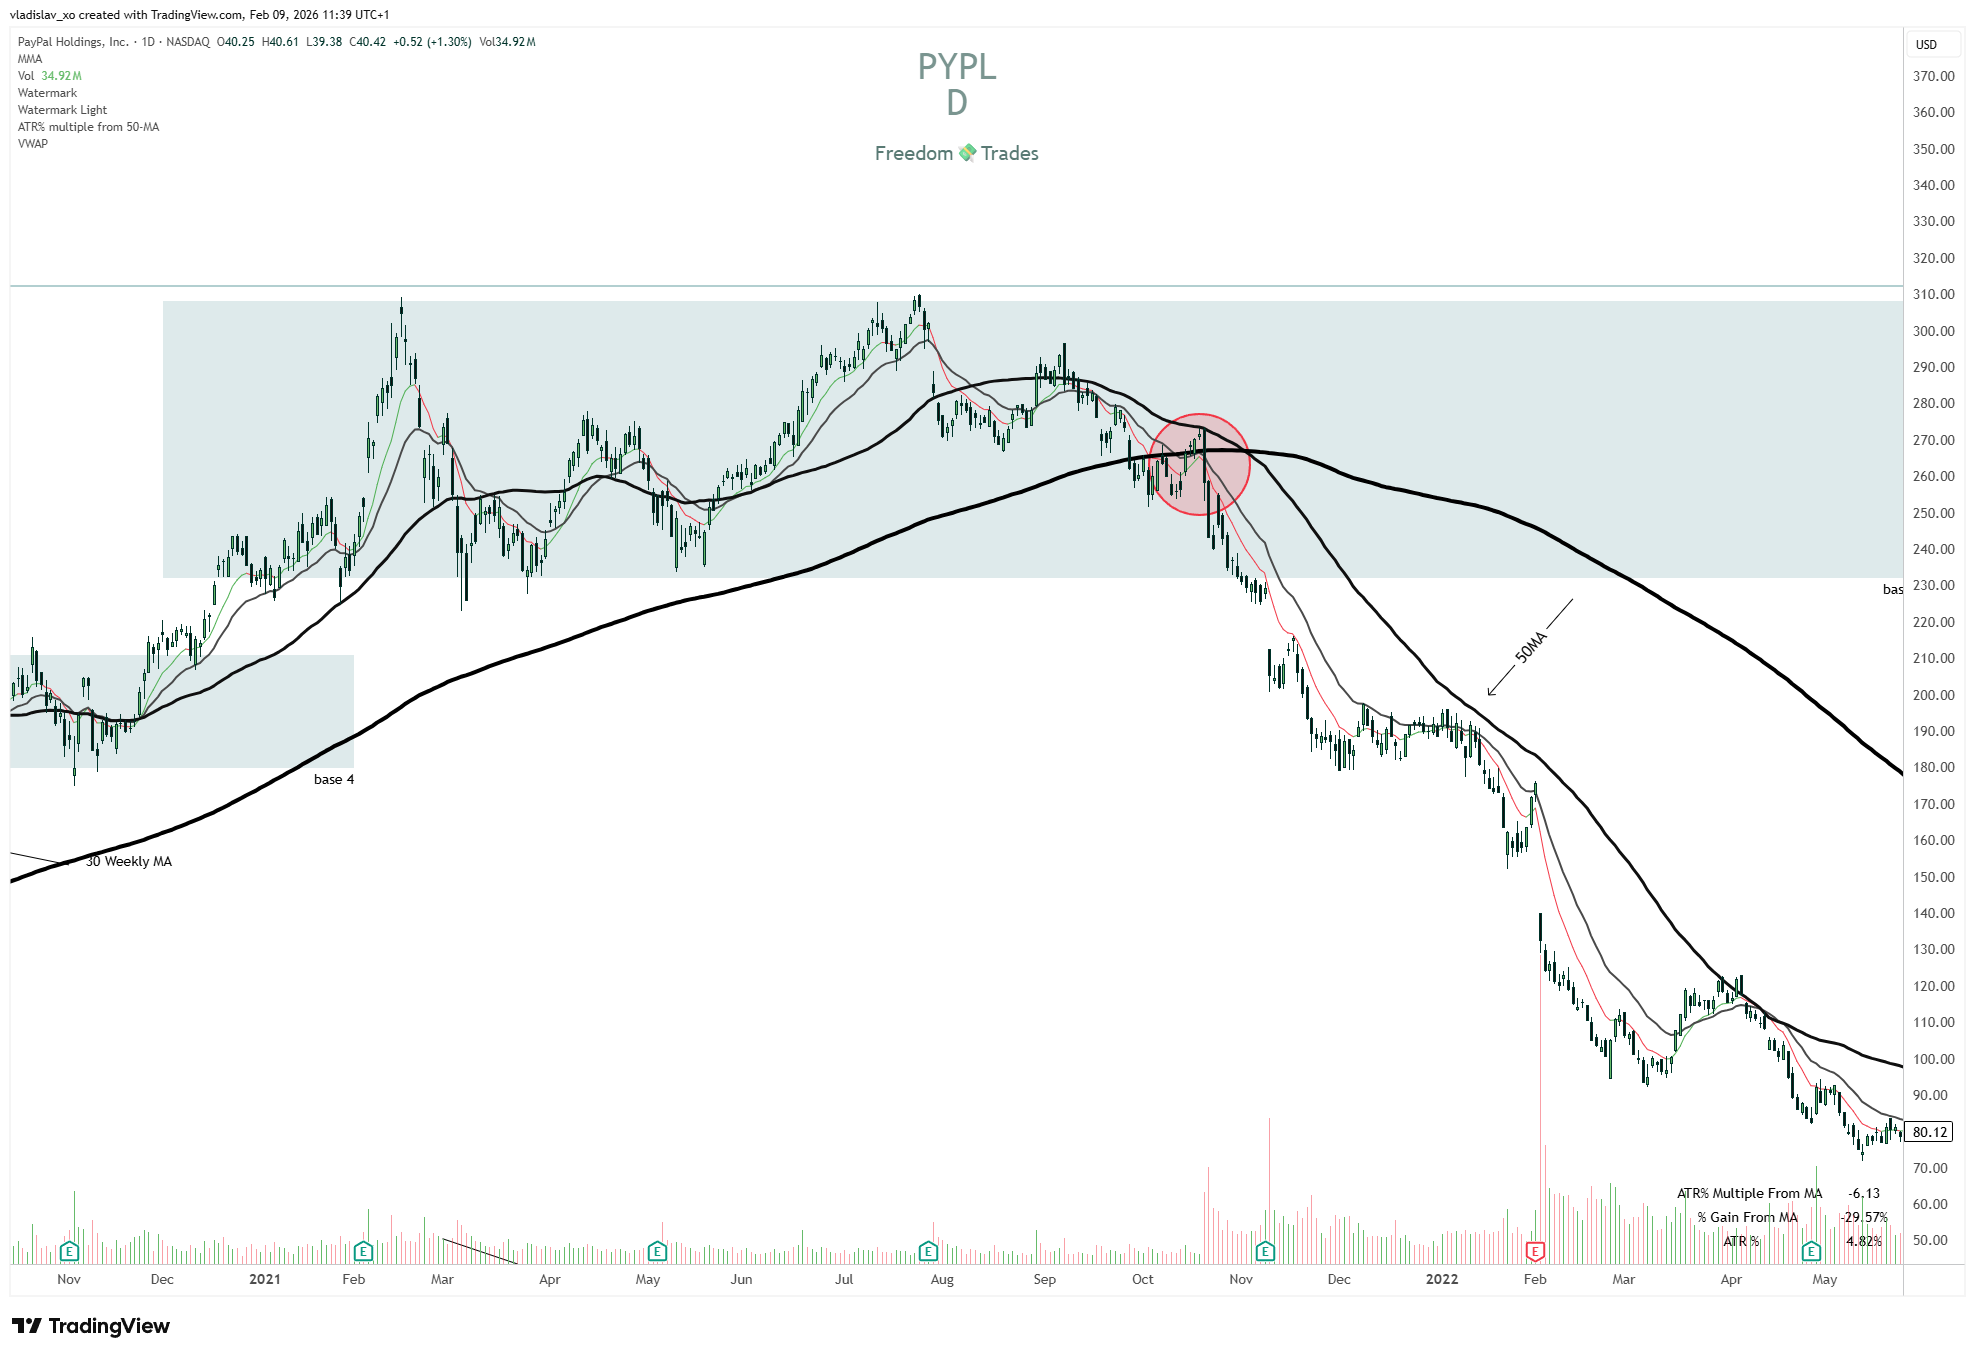
I wouldn’t have started shorting it until the price broke below the 200 MA, and I would have used the 50 MA on the daily as guidance for when to close the position.
So, don’t try to front-run the move, as you will get chopped up more often than not.
Stage 4 of a Stock - Markdown
In this stage, the stock is below the 200 MA and 50 MA on the daily and continues to decline. If you are long, this should be a signal to sell your positions, as they can lose considerable value if held during this stage.
For example, $PYPL lost 88% from its All-Time High (ATH).
Now, if you’ve made it this far, I want you to know two important things:
These concepts were established thanks to Stan Weinstein. If you want to read more about Stage Analysis, I highly recommend reading his book.
Today, I want to reward you for making it this far and for being a member of this community for some time.
1-Year Anniversary
On February 18, 2026, Freedom Trades celebrates its first year of existence. To celebrate this milestone and help those dedicated to turning pro, we are launching a Special Anniversary Offer:
I have decided to make the annual plans 73% cheaper than the monthly ones. This is the biggest offer I have ever made.
Currently, the annual plan costs $0.50 per day.
What else can you buy today for 50 cents???
It costs less than one coffee per week, or a Netflix subscription per month.
I don’t know a better deal than this.
This deal is limited until February 19 and is only available for the first 18 members.
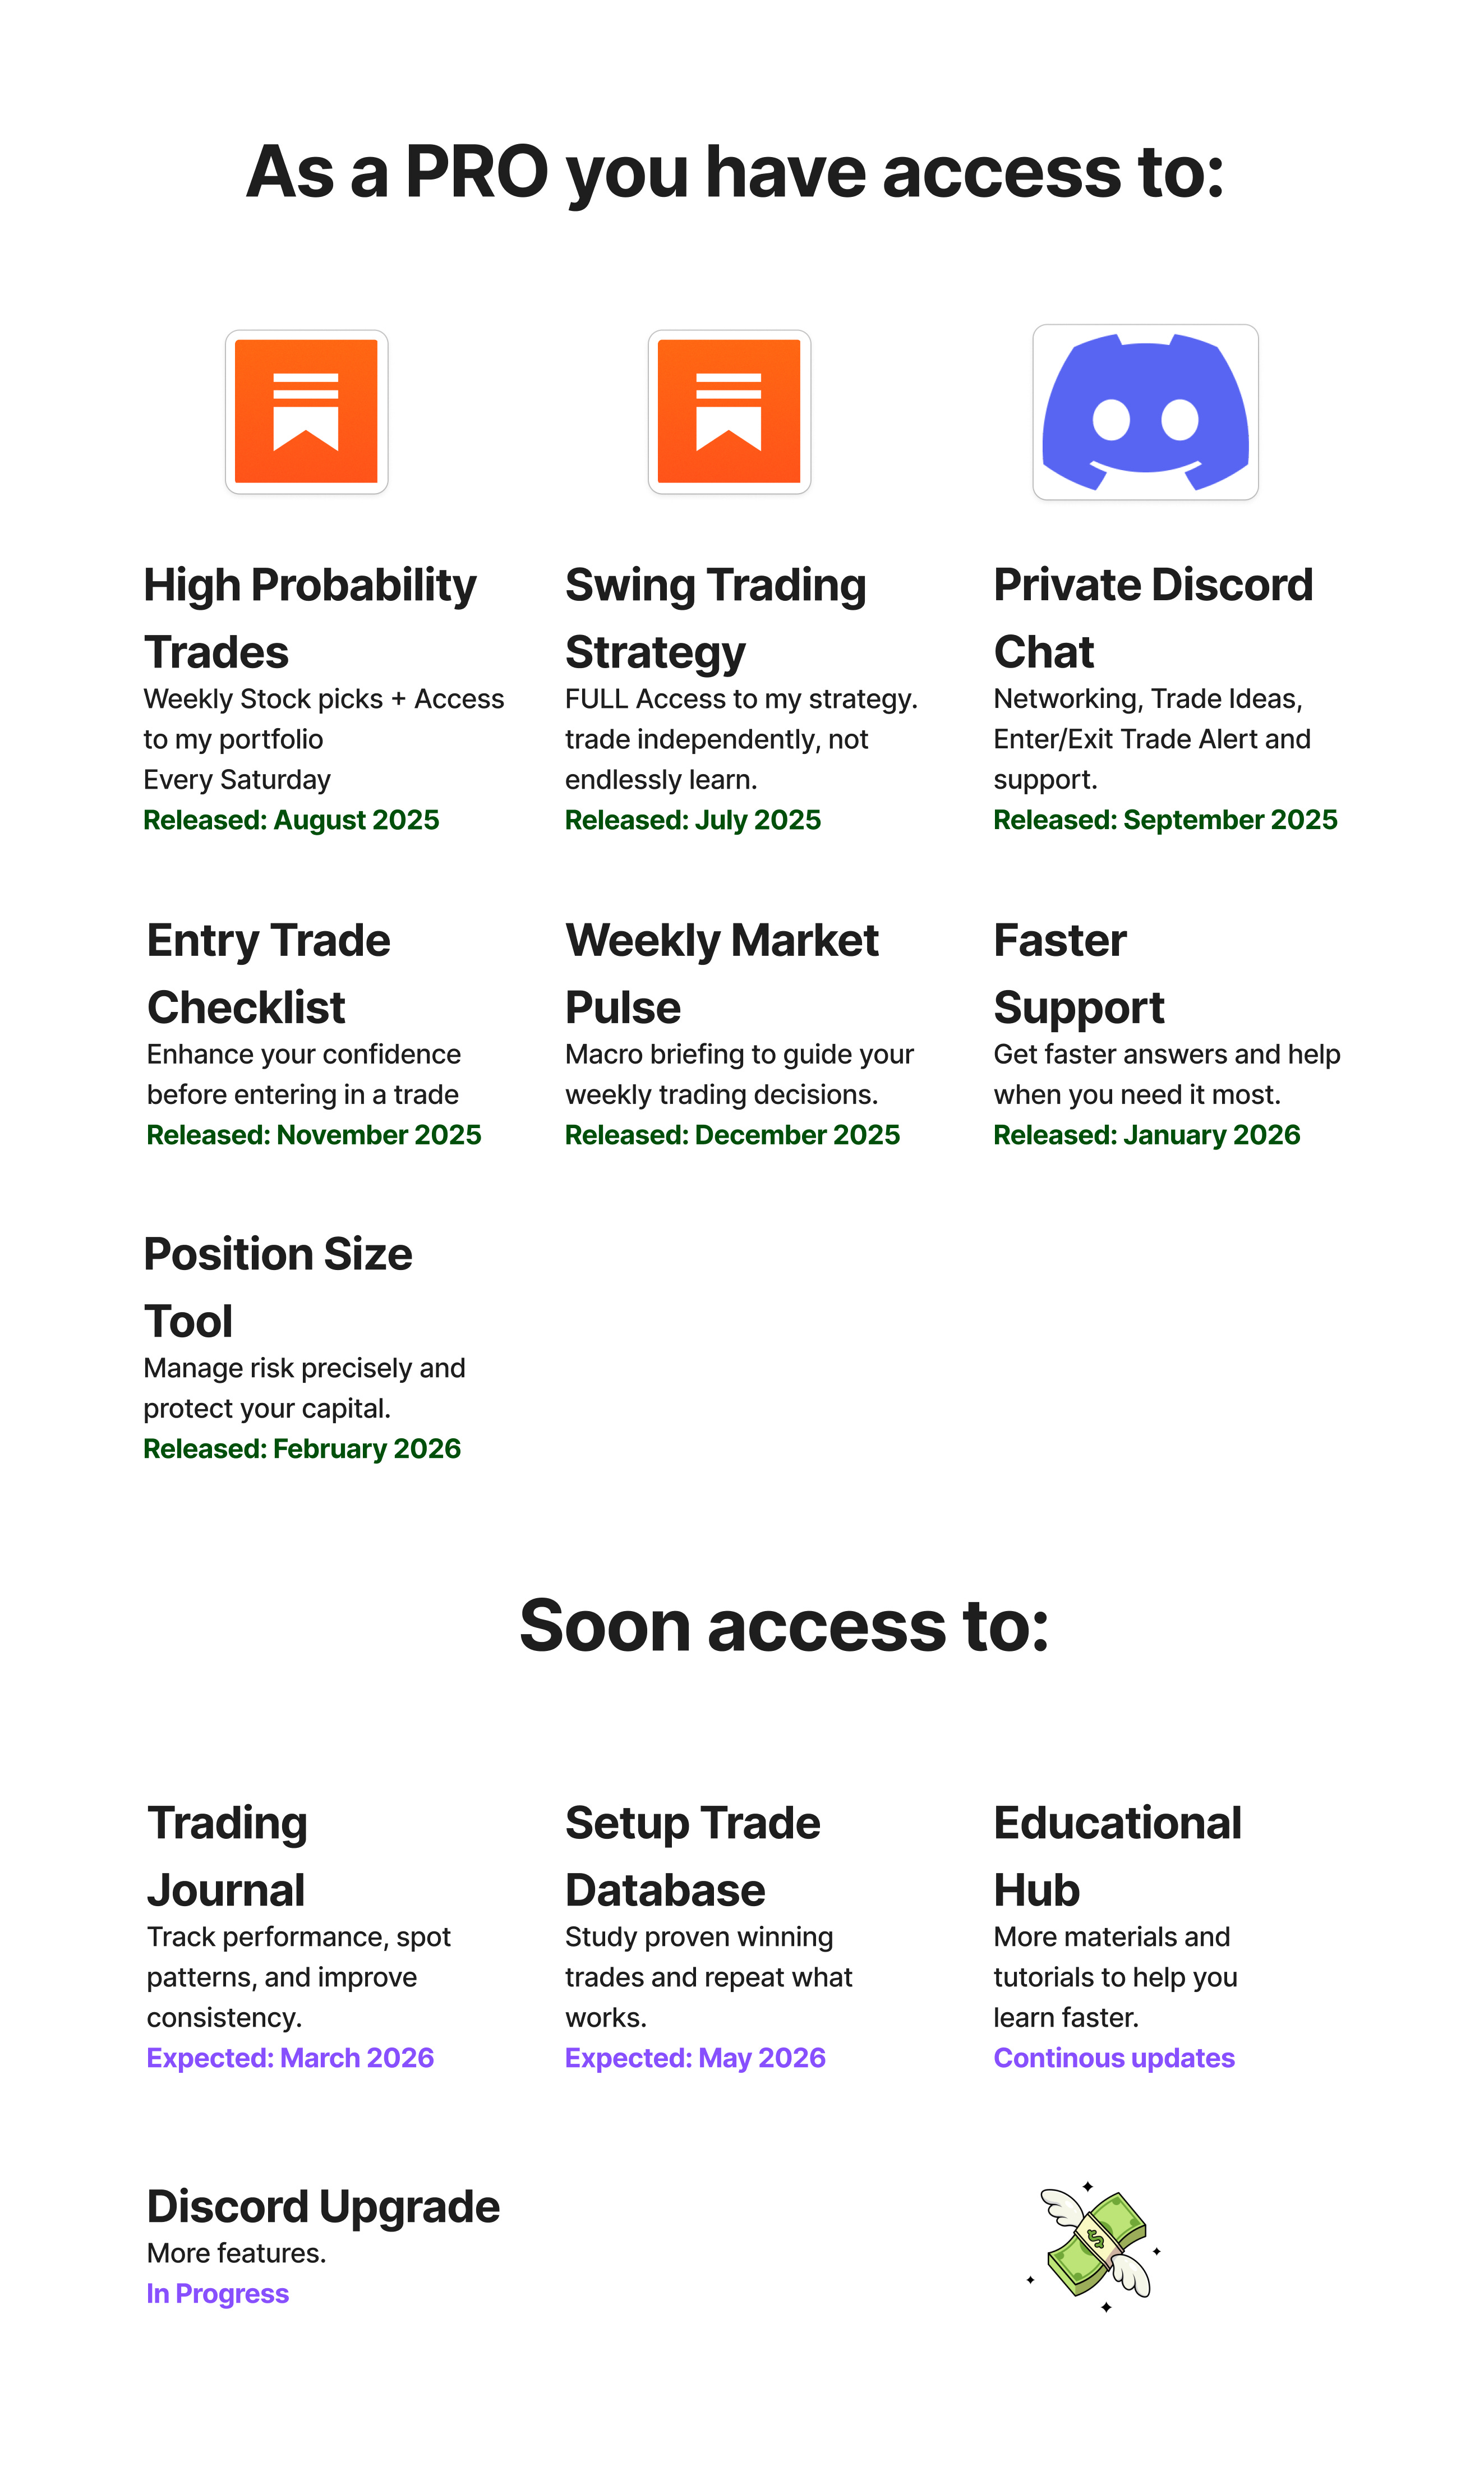
If you join our community, this is what you will have access to:
Trade Setups of The Week
4 High-Conviction Setups for This Week

This week’s PRO report breaks down my full momentum stock watchlist, including the setups I’m watching.
You’ll see my portfolio, my open positions, and the exact stocks I’m targeting.. all based on the same swing trading system.
If you want to trade smarter ,not longer , and get my weekly watchlist with setups, and portfolio breakdowns, this one’s for you.
Copy My Watchlist for next week
Here are the stocks, sectors, or trends I’m watching closely.
Access my entire watchlist for free here:
My watchlist
Want more than just a watchlist?
Get an understanding of the screener, so you know exactly what to watch.
Gain access to my trading strategy!
Join a community of like-minded individuals who are committed to achieving financial freedom and taking control of their future.
Upgrade now to get the full experience!
If you think this newsletter could help your friends, share it with them so it can reach as many traders as possible.
And here’s the fun part: when you share it, you can unlock special rewards + you will look smart in front of your friends :)
“One trade closer to freedom.”
Vladislav
The important question is also whether the 4 stages shall happen all over again.
That would make Paypal a screaming buy atm.
Those went fast. lol