The Most PROFITABLE Indicator YOU Should use in any strategy
The Only Indicator That Matters | Edition 27
Hello Traders,
Lately, I’ve been getting messages from you asking, “What is the best / most reliable / most profitable / etc indicator for trading?” Although I’ve already answered some of you in private, I thought it would be useful for the other few hundred traders who open my newsletter every week, also to find out what the best indicator for swing trading is.
It took me around 8 years to figure out what the best indicator is…some people get there much faster, others never do.
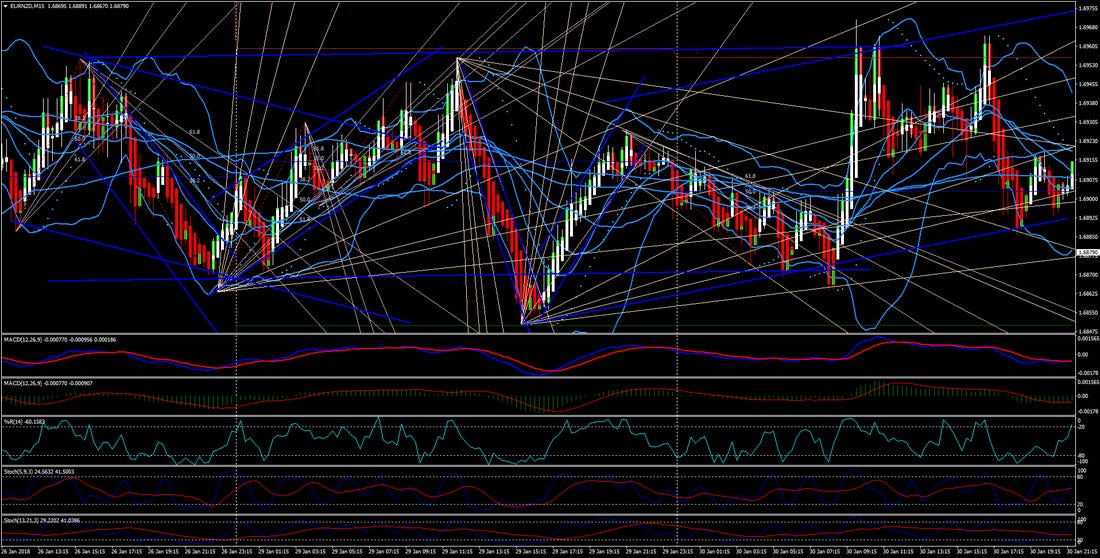
Although I couldn’t find a screenshot of what my screen looked like when I first started trading, I did find one online that looks very similar to what I had back then.
It looked something like this:
😂😂
Well, I was using MACD, RSI, Moving Averages, trend lines, Stochastic Oscillator, Bollinger Bands, sometimes Fibonacci retracements, Standard Deviation, Parabolic SAR, you name it…
I remember when my girlfriend would walk into the room, she’d always tell me how much of a genius I was because she couldn’t understand any of it.
That made me feel good… but the problem? I was unprofitable.
And I stayed that way for quite a while, until I started cutting them out one by one.
And at some point, I was left with a blank chart, no indicators at all.
That’s when I learned a new skill: Price Action (we’ll talk more about that in a future newsletter)
How I found the best indicator for trading
I watched and studied hundreds, thousands of hours of naked charts, just price action, how thousands of tickers react to different levels based on volume, how they form support and resistance, and how they hit those levels again and again, and again.
After I became comfortable trading a naked chart, I asked myself what I could add, a supporting indicator that wouldn’t influence my decisions but would simply help confirm the trend.
Volume was always present (I don’t even consider it an indicator…), but what I added was the Moving Average and RSI (although this indicator weighs very little in my decision-making).
And then, armed with these two weapons: Price Action + 2 indicators, I went to war!
And suddenly, I became a breakeven trader!
Which, in my world, is a huge win! If you’re a breakeven trader, you’re part of the 20% who don’t lose money… you should be proud of that.
And now you’re probably wondering: What took me from breakeven to profitable trader?
The indicator that took me from breakeven to profitable trader
What made the difference?
Well, the answer to the question what’s the best indicator is: Situational Awareness!!!
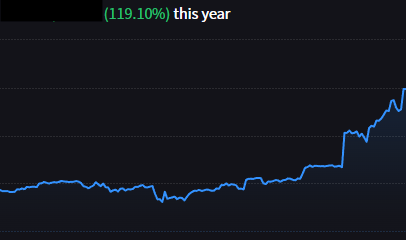
That’s what propelled me into becoming a profitable trader and achieving triple-digit returns and a six-figure portfolio in less than 2 years.
And I’m going to explain what I mean by Situational Awareness.
This applies to systematic traders, but especially to discretionary traders.
Situational awareness in trading means knowing exactly what context you’re in before you hit "Buy" or "Sell".
It’s not just about seeing what the price is doing, but about understanding what’s happening around that move.
Before jumping blindly into a position just because your indicator or strategy says so, you need to ask yourself:
What’s the overall trend? (Are you in a bull market or a bear market?)
Where are you in the structure? (At the beginning of a trend? In the middle? Or in a distribution/accumulation zone?)
What’s volume doing? (Is it confirming the move or contradicting it?)
What are the major indexes, the sector, the news doing? (Macro context)
Does that specific ticker have a catalyst (a news release, a deal with a big company, a contract win, an earnings beat?)
Why is this important?
Because without context, a good technical signal can be a trap. If you see a breakout and enter without realizing it's the end of a trend or near major resistance, you might be buying right at the top.
The better your awareness, the better you can calibrate your trade size.
If you're in a favorable context and have a clear signal, you can go in with a much bigger position, and that’s what gives you outsized gains and supercharges your account!
If the context is uncertain, you keep your size small or stay on the sidelines.
That’s how you start identifying the quality of a trade setup.
Is it a AAA+ trade? Size big!
Why I Gave Up on Indicators
One last thing before we dive into this newsletter.
One of the main reasons I gave up using tons of indicators was that they gave me mixed results.
And I no longer knew what to believe, or who to believe...
"Is it a good time to enter a position or not?"
Also, indicators are lagging because they’re based on past data, not on what’s happening right now.
So again: Situational Awareness!! It beats everything!
PRO TIP: You can start building a system for this situational awareness, to make your process even more systematic!
For example:
We’re in a bull market … (add 10 points to the trade)
The stock has no catalyst… (minus 5 points)
Etc… you get the idea.
A big thank you to my paid subscriber, Fritz, for giving me the idea to write about Situational Awareness in this edition of the newsletter!
Trade Setup of The Week
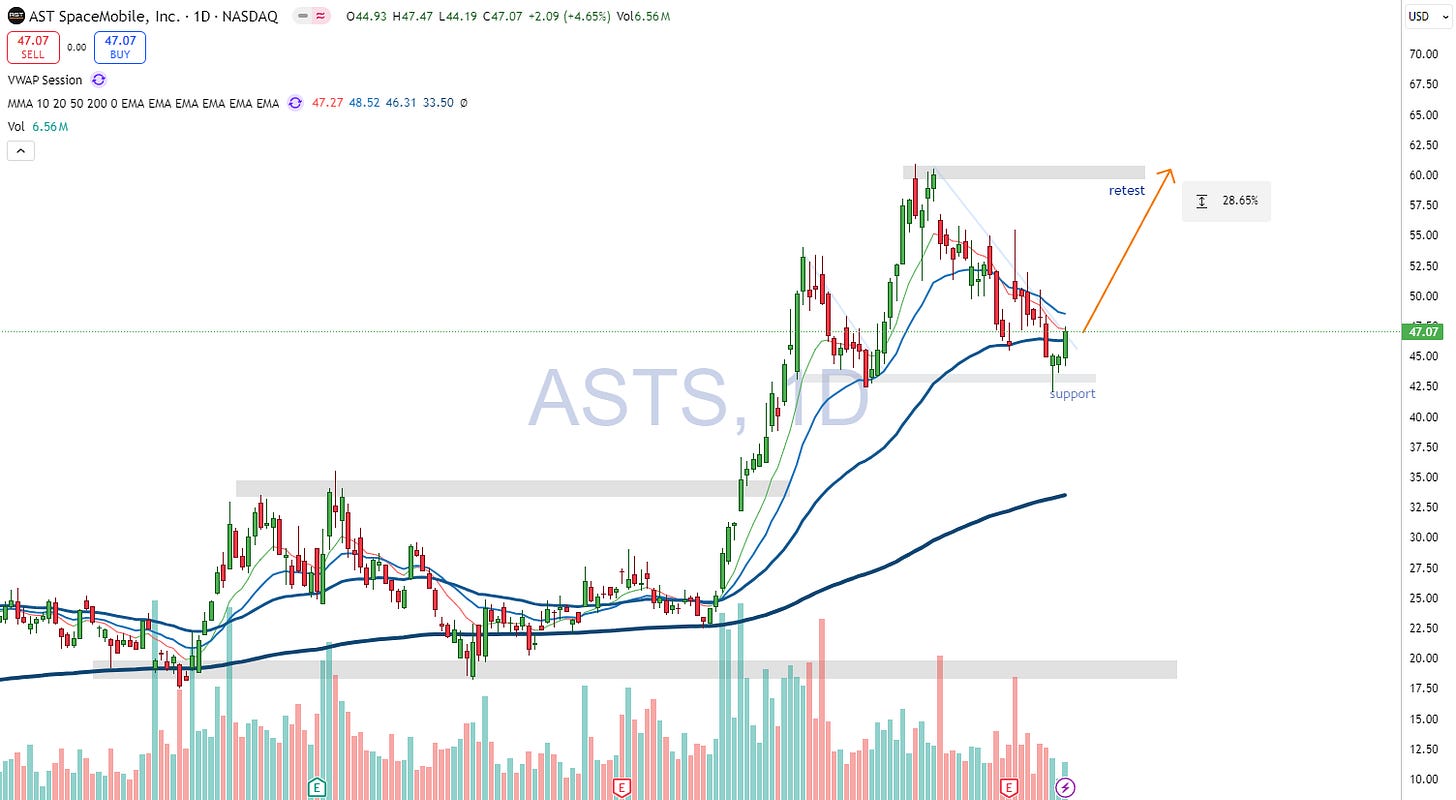
Ticker: ASTS 0.00%↑
On Thursday, I bought 230 shares at $45 and entered a long position after seeing how Wednesday closed, when it rejected the previous support at the $42 level.
I still believe the setup is valid according to the strategy, and I think it has a pretty good chance to at least retest the $52–55 level. If it manages to reach the previous high, we’re looking at a potential 28% reward.
I announced this trade live in the PRO community chat.
Also, besides this opportunity, I’ve shared 11 more here:
Copy My Watchlist for next week
Here are the stocks, sectors, or trends I’m watching closely.
Access my free watchlist here:
My watchlist
Want more than just a watchlist?
Get an understanding of the screener, so you know exactly what to watch. Gain access to my trading strategy, built to maximize returns while managing risk.
Plus, join a community of like-minded individuals who are serious about financial freedom and taking control of their future.
Upgrade now to get the full experience!
Key economic events to watch next week
Light start to the week, but things heat up from Thursday.
Thursday: GDP 2nd estimate could shake markets if it surprises.
Friday: Core PCE, Personal Income, and Spending, key inflation and consumer strength signals.
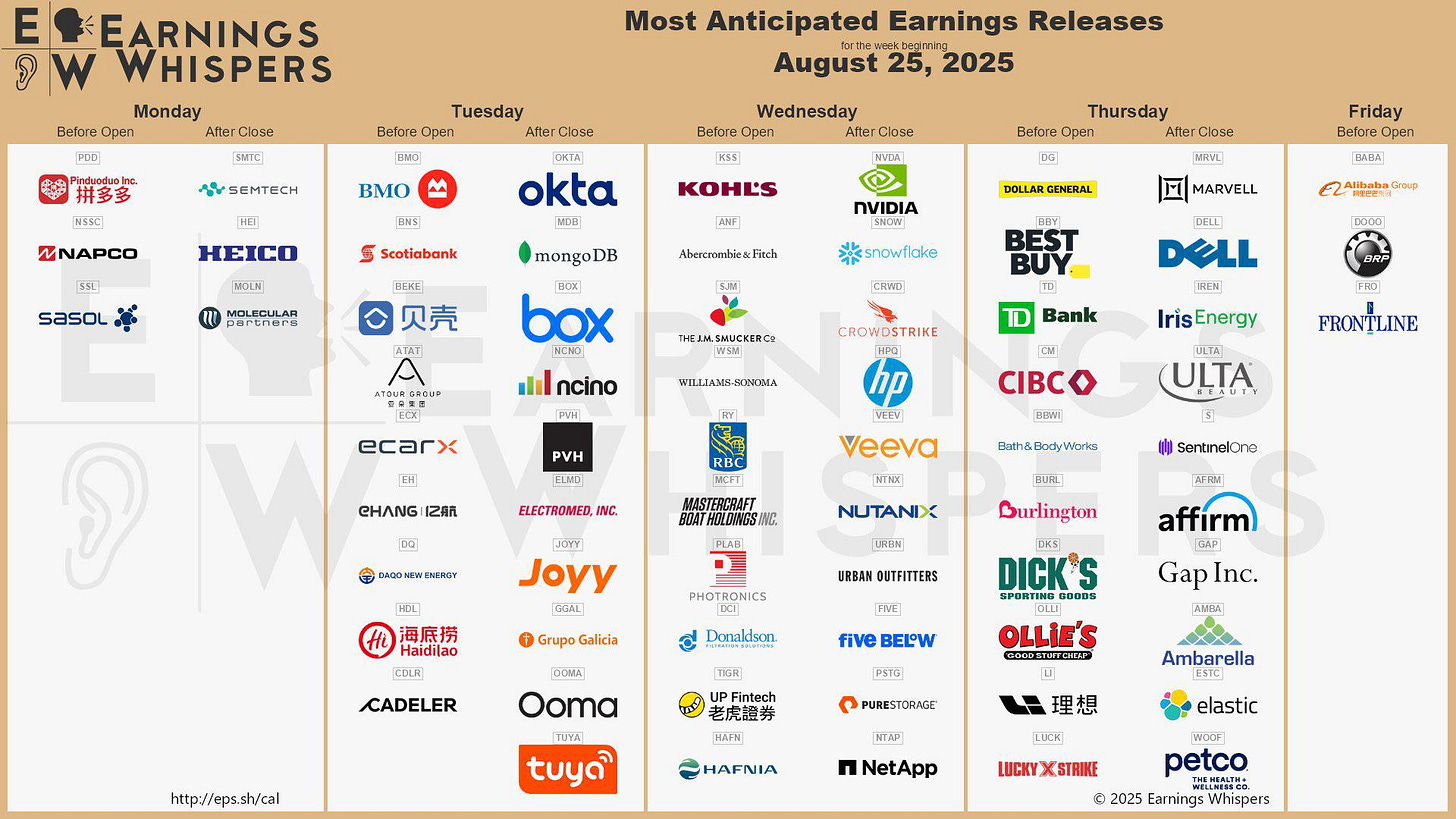
Earnings to Watch Next Week
Here are the most interesting earnings reports coming up:
Wednesday (Aug 27):
NVIDIA (NVDA)
Snowflake (SNOW)
CrowdStrike (CRWD)
Thursday (Aug 28):
Dell (DELL)
Best Buy (BBY)
Friday (Aug 29):
Alibaba (BABA)
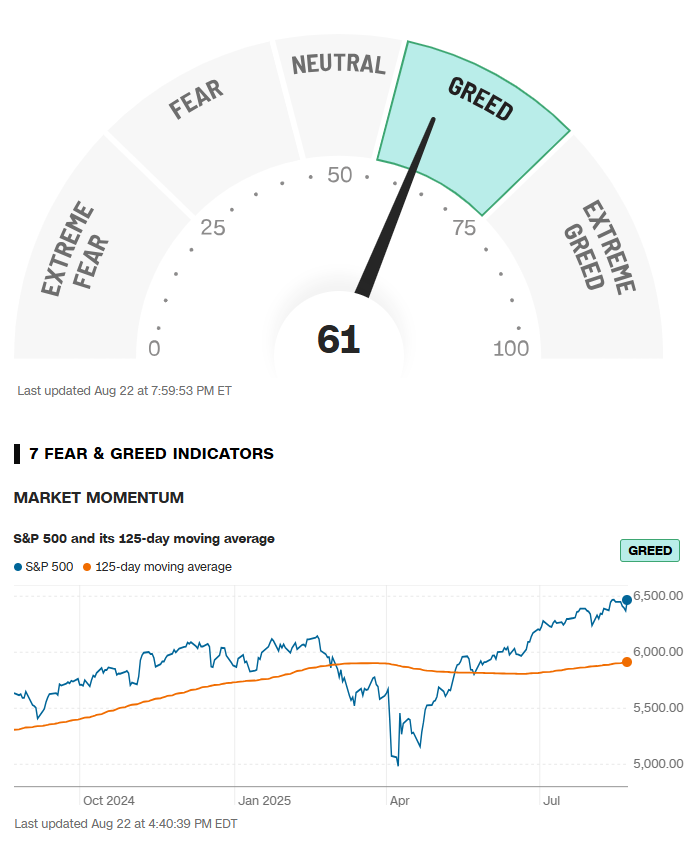
Fear & Greed Index of the week
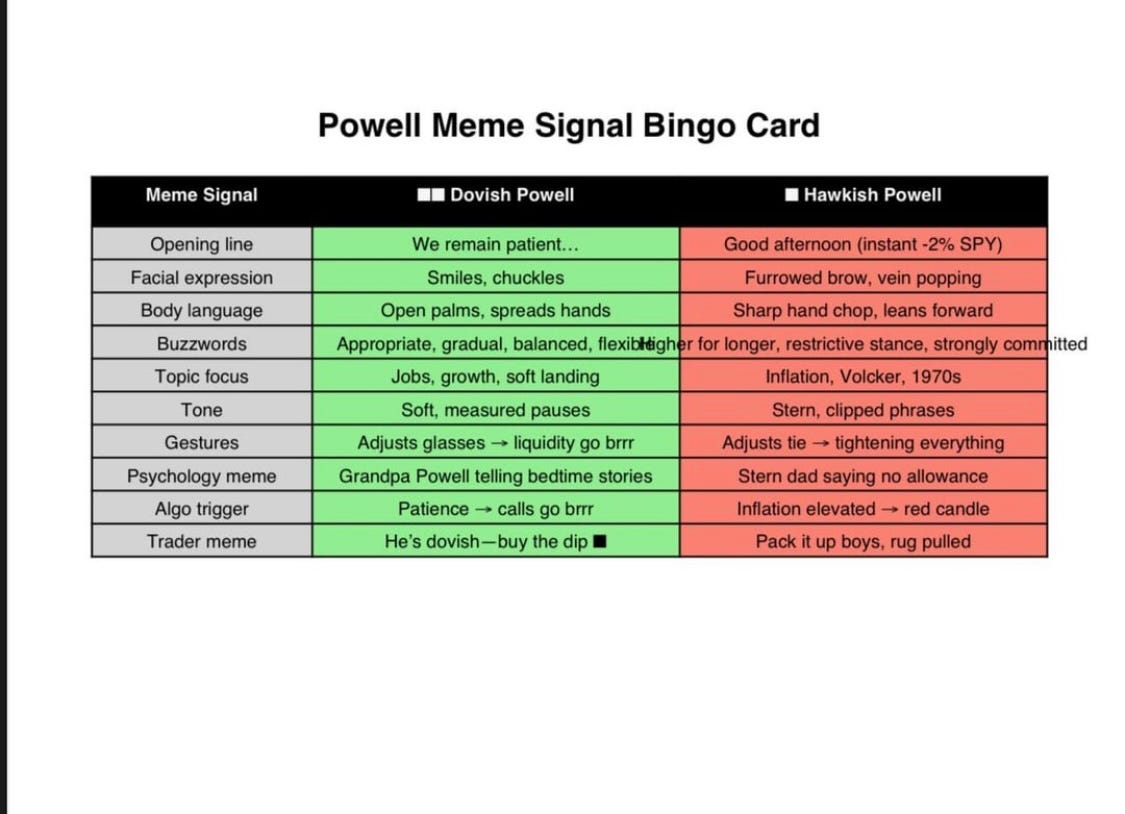
Financial Meme of the week
Thank you for being with me in this edition. If you think this newsletter could help your friends, share it with them so it can reach as many traders as possible. And here’s the fun part: when you share it, you can unlock special rewards, exclusive insights, premium content, and more.
“One trade closer to freedom.”
Vladislav


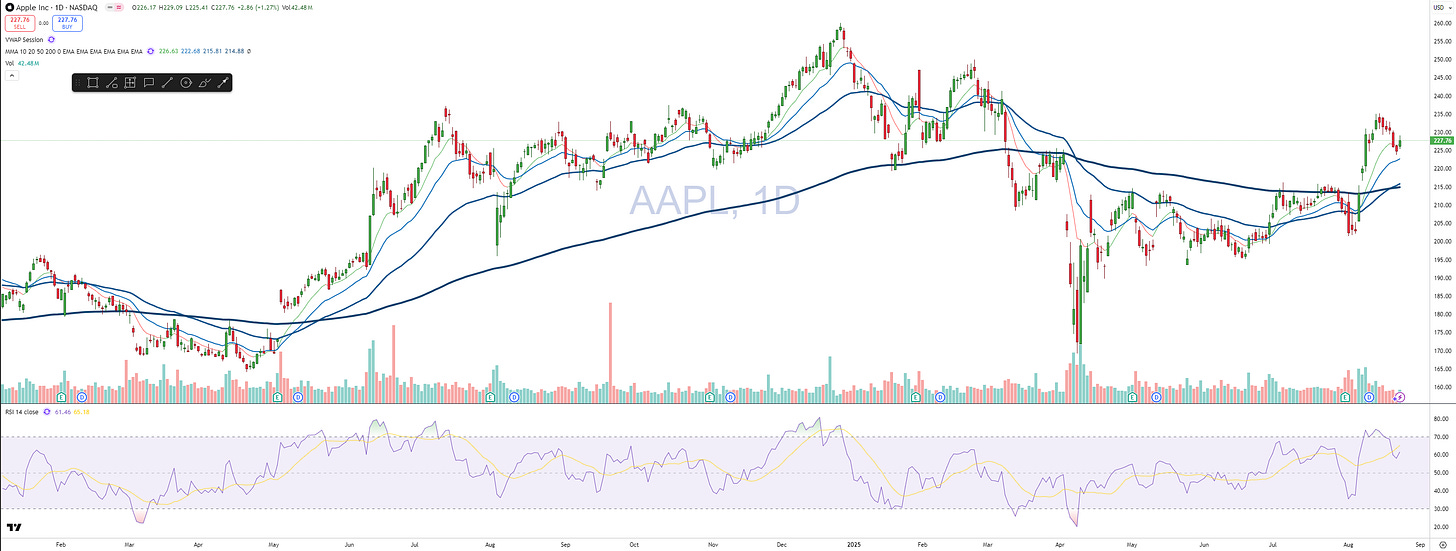


How do you know where you are in the trend?
For #2 you mentioned, are you in the beginning, the middle or the end of the trend? How does one know