

Enter the Big Rally at the Perfect Moment
How to pick up the bottoms | Edition 71

There is a signal that tells you exactly when the market is ready to run.
And that signal has been working for hundreds of years.
It is called The Follow Through Day.
By the end of this article, you’ll know exactly how to spot it, what it means, and how to use it to enter the market with confidence, right as a new uptrend begins.
Why You Should Listen
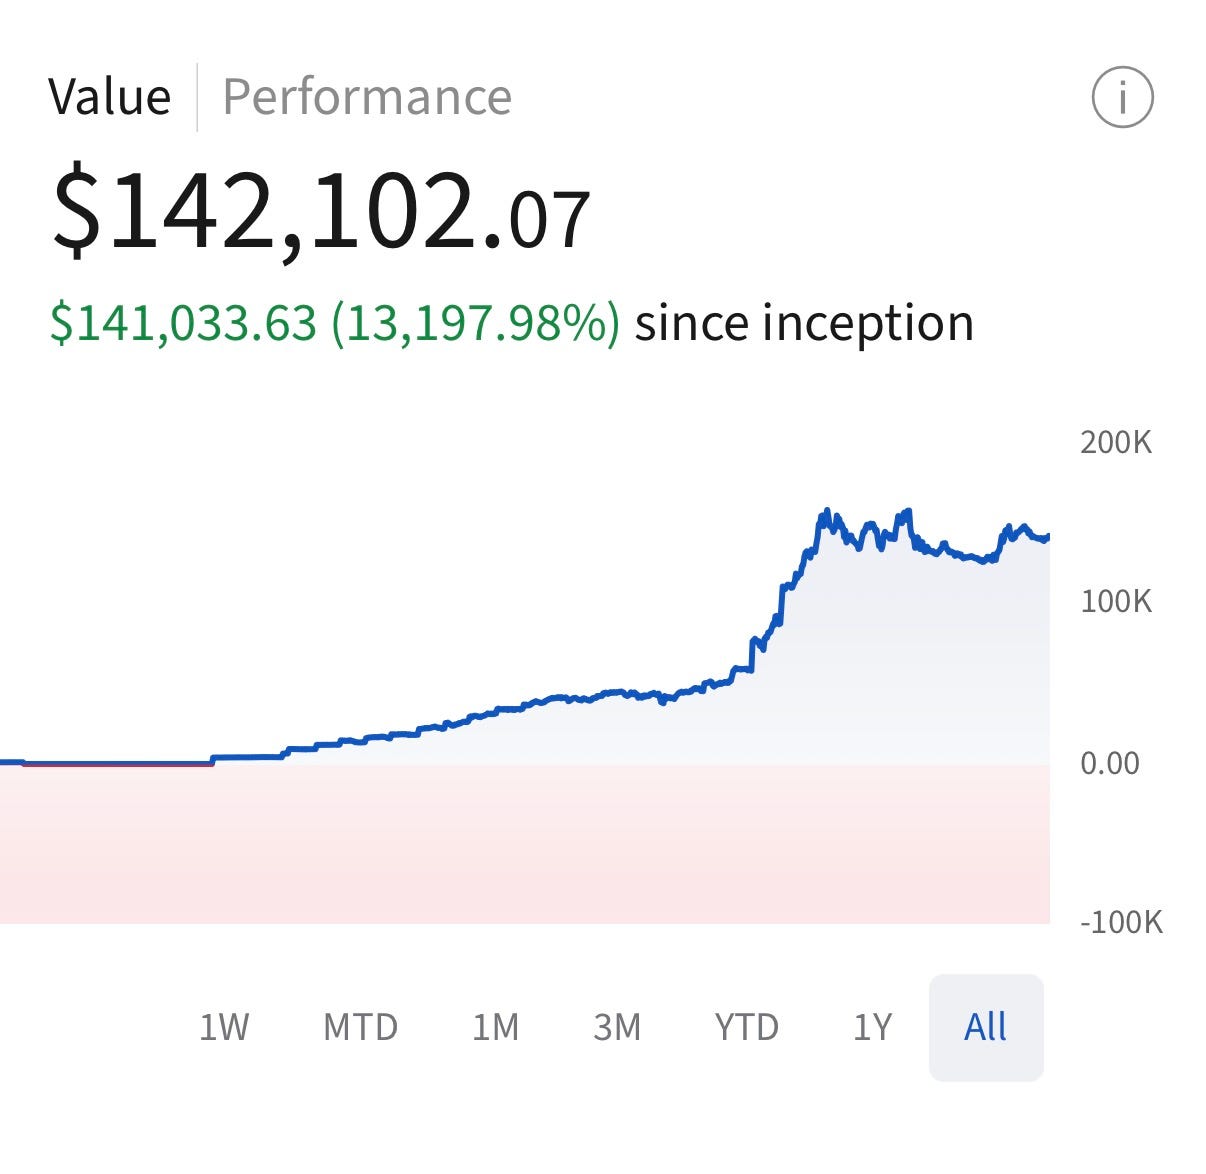
I’ve been swing trading US stocks for over 4 years and an investor for 10 years.
I turned a $2,000 account into six figures, and I’ve lived through bull markets, crashes, and everything in between.
The Follow Through Day is one of the few signals I trust completely.
It kept me out of bear market traps.
It put me in position for some of my best runs.
Here’s What We’ll Cover
First, we’ll break down what a Follow Through Day actually is and where it comes from.
Then I’ll show you the exact criteria I use to confirm one.
And finally, I’ll walk you through how to build your watchlist around it, so when the signal fires, you’re already ready to act.
What Is A Follow-Through Day?
A follow-through day is a day that signals a potential market reversal is starting.
Meaning real buying strength appears after a period of decline or consolidation.
Think of it like this, the market has sold off, then it starts to stabilize and show the first signs of a rebound.
A follow-through day is the moment that rebound gets confirmation, not just a random bounce.
What Is A Follow-Through Day Made Of
Before we can spot a follow-through day, we need to understand what it is made of and in which scenario it appears.
To identify it, we need the following components:
A correction phase, a market correction is usually considered when the index drops more than 10 percent from recent highs.
Day 1, the first green day of the rebound, a strong close higher than the previous day that starts the rally attempt.
The follow-through day itself, which is counted from day 4 onward and typically appears between days 4 and 8 of the rally attempt.
What A Follow-Through Day Looks Like
Now we will go straight to the charts, because it is much easier to explain and understand visually.
We will use as an example the most recent market correction in QQQ, the one from April 2026.
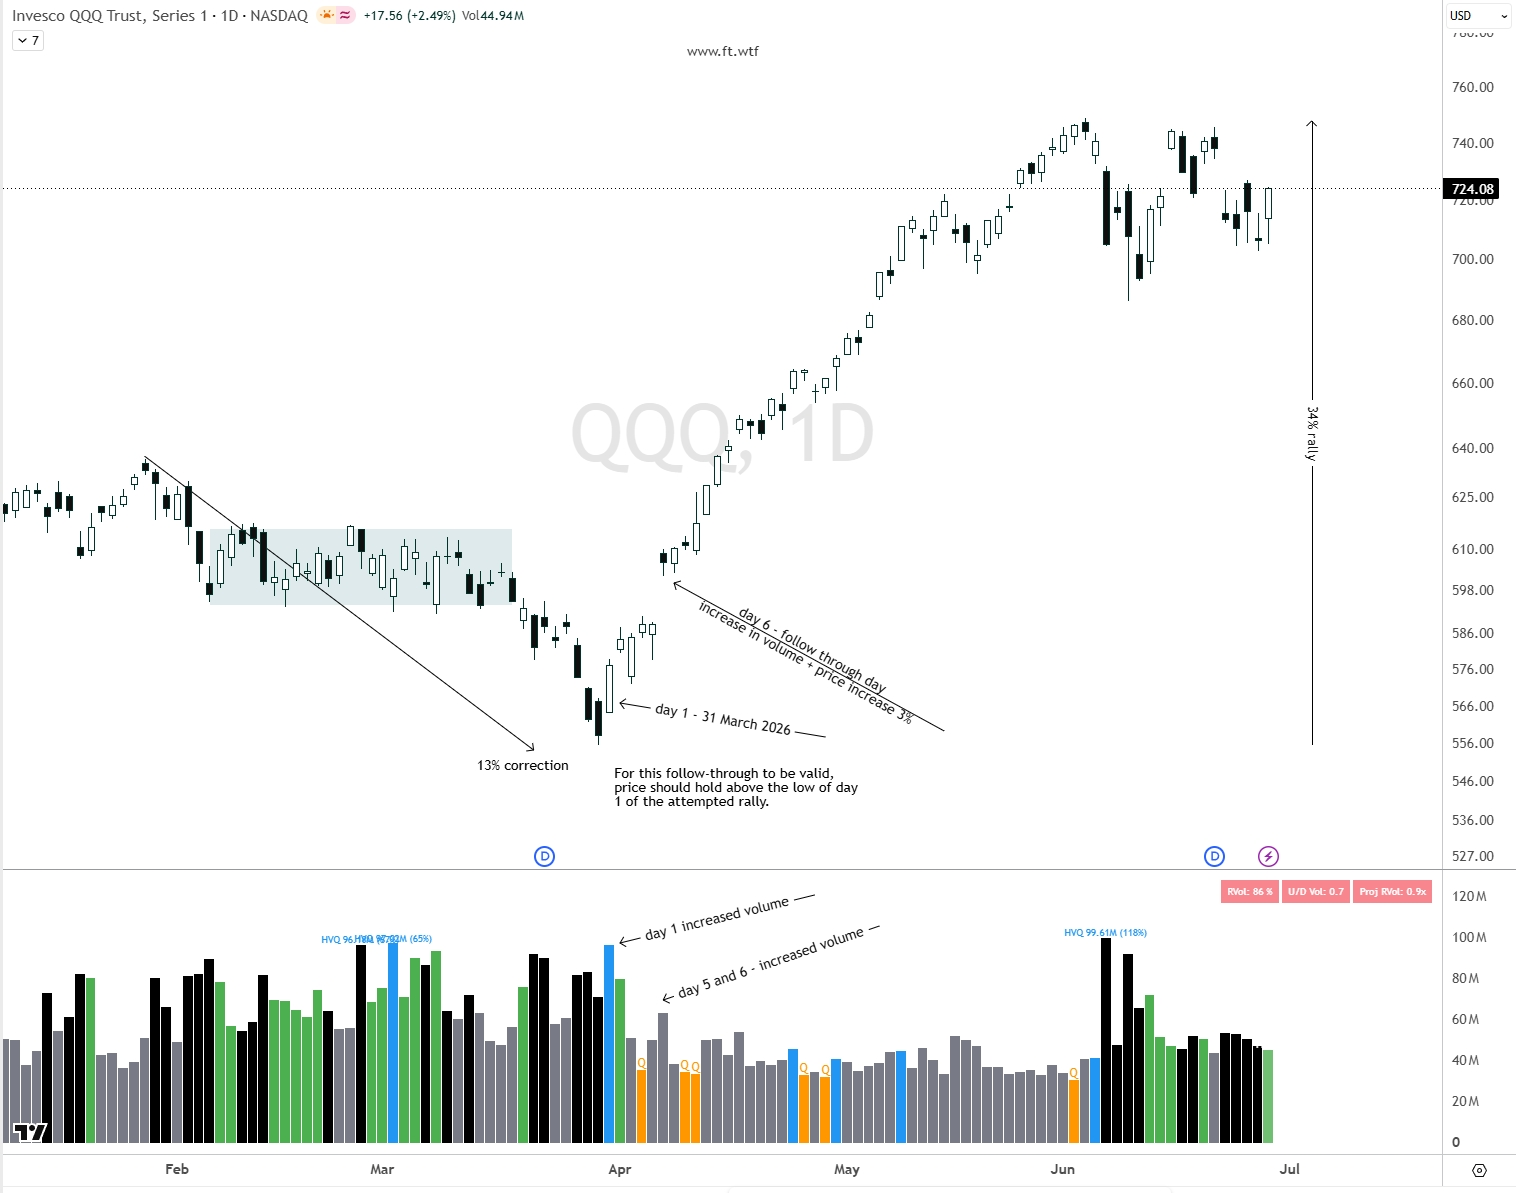
Observe how it had all the ingredients we talked about above.
It had a market correction of about 13 percent.
Day 1 came on March 31, 2026, with higher volume than the previous day and a gain of roughly 3.4 percent.
On day 6 we got the follow-through day, a move of more than 2 percent on strong volume.
After that, QQQ went on to rally around 31 percent.
For the follow-through day to occur and remain valid, price must not undercut the low of day 1.
Once that low is intact, we wait until at least day 4.
Why. Because historically this window allows the market to stabilize and prove that the initial move is more than just a simple bounce.
Rallies that trigger earlier than day 4 are usually less reliable.
And next, I will show you a clear example of a failed follow-through.
What A Failed Follow-Through Day Looks Like
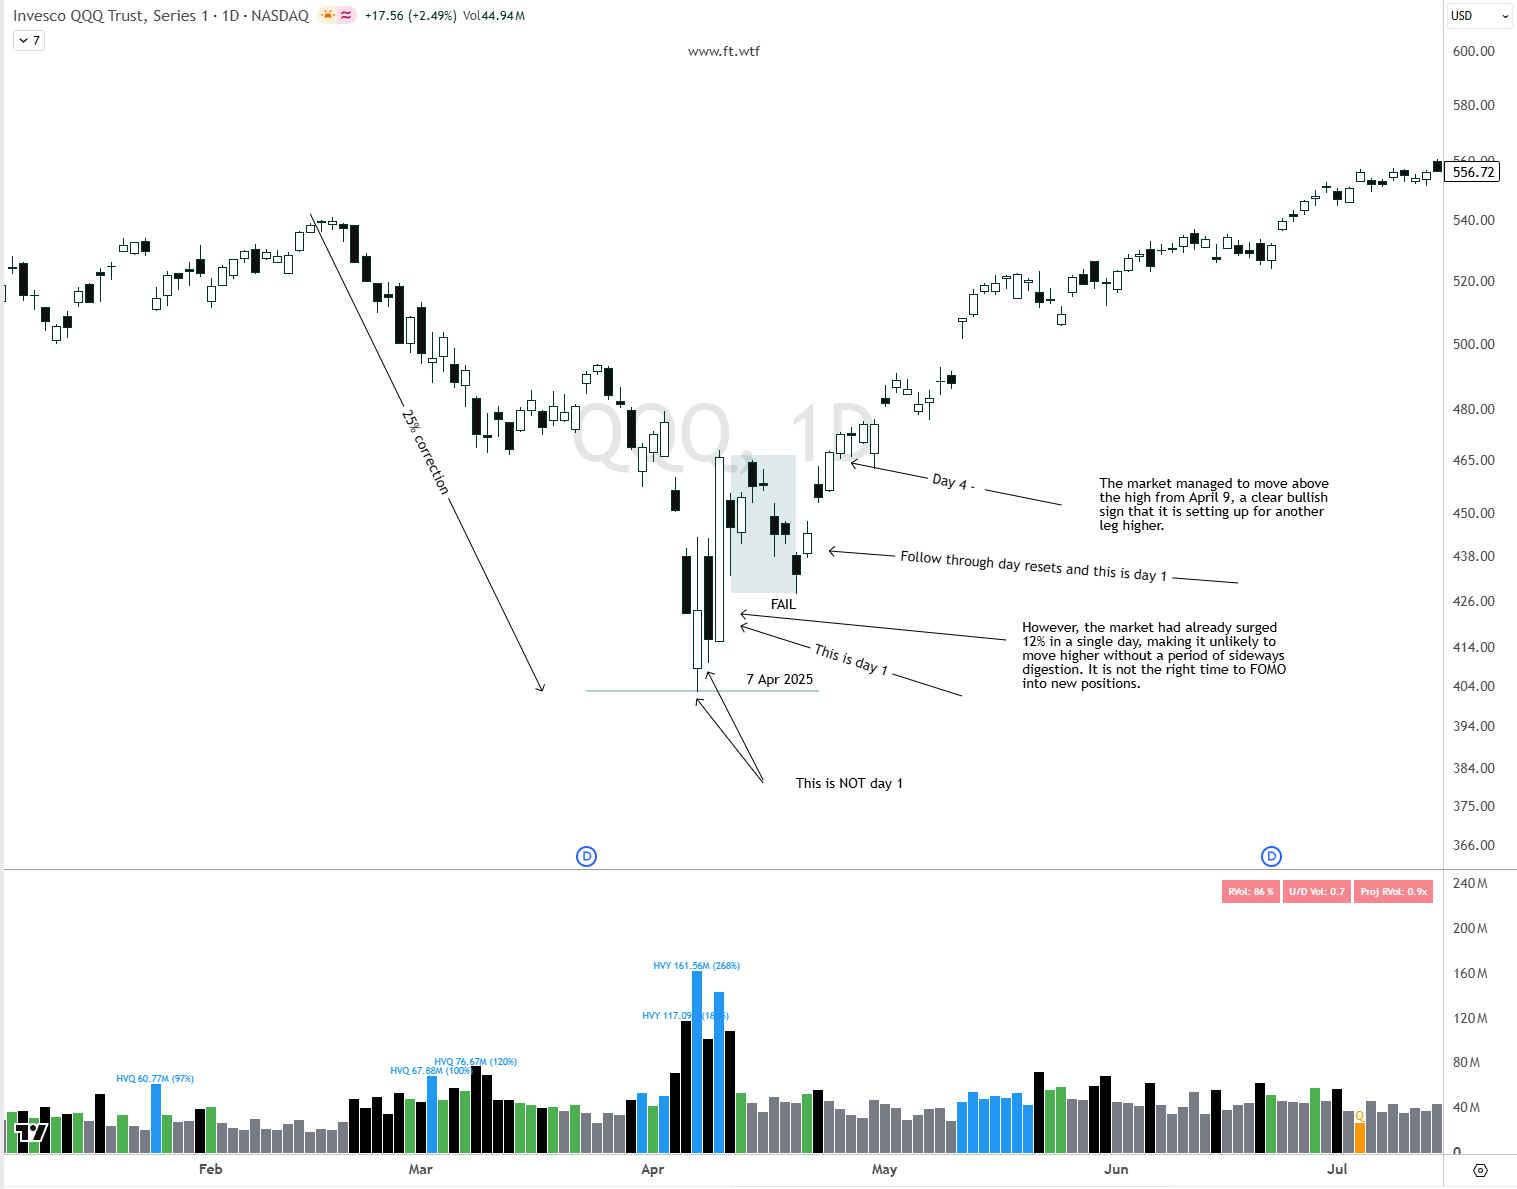
This example is from April 7, 2025.
It has:
A market correction of around 25 percent.
An attempted rally on April 9.
Important, day 1 of the rally was April 9, not April 7 or April 8, because those days did not manage to show real follow-through, even though the low of the day was not broken.
So the count reset, and day 1 became April 22, 2025.
From that point, the market went on to rally another roughly 57 percent into the next phase of consolidation and correction.
The Benefits Of Spotting A Follow-Through Day
This concept can make a huge difference in your trading performance and long term profitability.
BECAUSE
identifying a follow-through day:
Helps you see more clearly when the market is starting to turn back up.
Shows you that the rebound has real strength, not just a quick reaction or random bounce.
Keeps you from entering the market too early.
Reduces the chance of buying into a false rebound.
Trains you to wait for confirmation instead of reacting emotionally.
Helps you stay aligned with the overall market trend.
Gives you more confidence in your timing when you decide to step back in.
Also, according to William J. O’Neil, these are the key follow-through day statistics you can use to your advantage.
Distribution on days 1 or 2 after a FTD fails 95 percent of the time.
Distribution on day 3 after a FTD fails 70 percent of the time.
Distribution on days 4 or 5 after a FTD fails only 30 percent of the time.
Improve Your Edge With The Follow-Through Day Signal
You can combine the follow-through day signal with market breadth so you can be even more confident in the signal.
Market breadth shows how many stocks are participating in a market move, so you can see whether the rally or selloff is broad or narrow.
You can do this directly with TradingView.
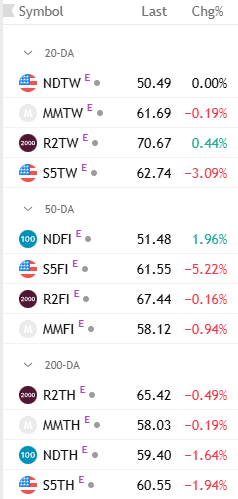
What I did was create a watchlist and add the following tickers from the screenshot.
You can copy them too: NDTW, MMTW, R2TW, S5TW, NDFI, S5FI, R2FI, MWFI, R2TH, MWTH, NDTH, S5TH.
Basically, these tell you how many stocks in the S&P 500, Russell, and Nasdaq are above their 20 day moving average, 50 day moving average, and 200 day moving average.
If you see that more than 50 percent of stocks are above the 20 DMA, it means breadth is improving and the majority is participating in the rally.
If they are below, it is the opposite.
You can also track how the sectors are behaving.
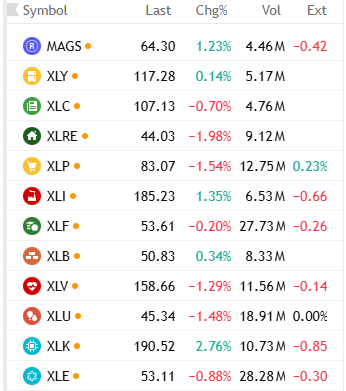
In the same way, you can create a free watchlist on TradingView with the following tickers, XLY, XLC, XLRE, XLP, XLI, XLF, XLB, XLV, XLU, XLK, XLE, MAGS.
And finally, track the leaders from each sector or group.
They are the first ones that will break out from the consolidation bases they have built.
If they are performing well, that is a very strong signal.
When you put all of this together, you stop guessing market bottoms and start following a clear, repeatable process.
You wait for a true follow-through day, you confirm breadth and sector leadership, and you focus on the strongest names breaking out of proper bases.
If you want help applying this in real time, with live follow-through day analysis, curated watchlists, and trade ideas you can mirror in your own account, then Freedom Trades PRO is built exactly for that.
If you are thinking about joining the community, right now is the best time to do it.
The yearly plan is 49% off.
Click the button, join Freedom Trades PRO with the yearly plan, and come trade with us, in real time.
See you inside :)
Trade Setups of The Week
High Probability Trades for 29 June - 3 July 2026

This week’s PRO report breaks down my full momentum stock watchlist, including the setups I’m watching.
You’ll see my portfolio, my open positions, and the exact stocks I’m targeting.. all based on the same swing trading system.
If you want to trade smarter ,not longer , and get my weekly watchlist with setups, and portfolio breakdowns, this one’s for you.
If you think this newsletter could help your friends, share it with them so it can reach as many traders as possible.
And here’s the fun part: when you share it, you can unlock special rewards + you will look smart in front of your friends :)
“One trade closer to freedom.”
Vladislav