

Undercut and Rally Setup Explained in Swing Trading
The Setup That Has Made Me Tens of Thousands of Dollars | Edition 65

Most traders get stopped out right before the biggest move of the year.
They watch the stock flush below a key level, hit their stop, and then stare at the screen as price immediately reverses and runs 30%, 40%, 50% without them.
It feels like the market is personally targeting you.
The truth is, it kind of is.
And today I am going to show you exactly how to be on the right side of that move.
The setup is called the Undercut and Rally (U&R), and it has made me tens of thousands of dollars.
One of the trades was NVDA.
NVDA had been trending beautifully, then pulled back hard through the 20 SMA. Every holder who had their stop just below that moving average got flushed out in a single session.
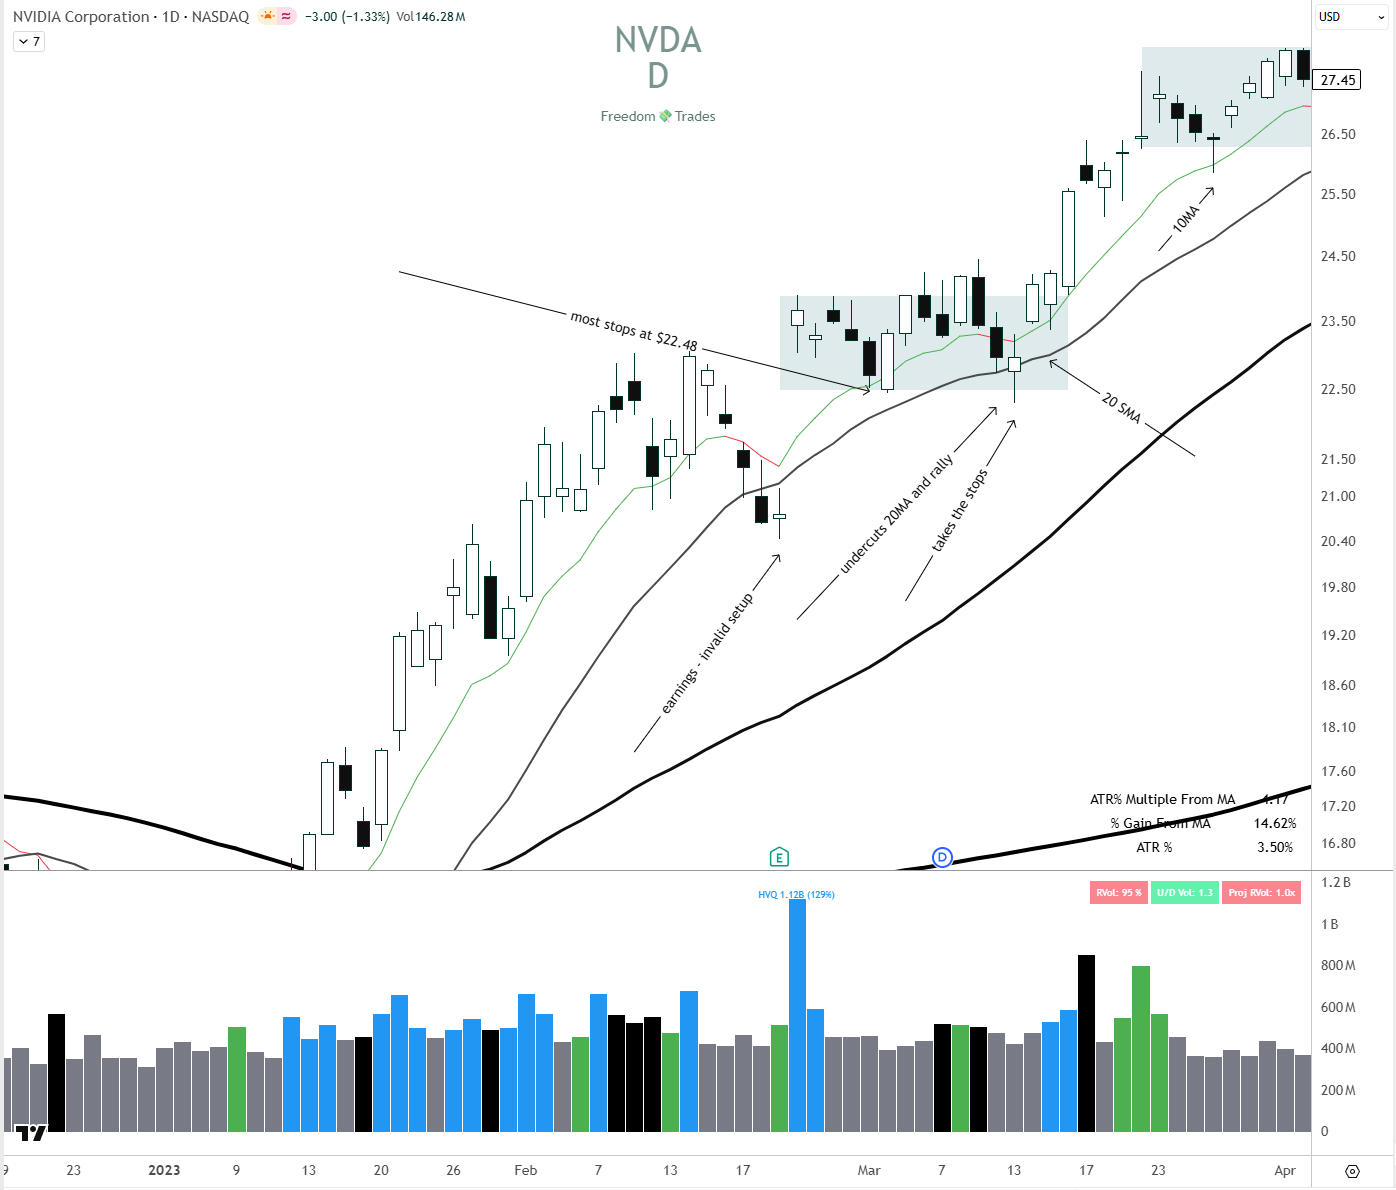
I had marked the level the night before.
I waited for the reclaim. I entered.
The stock ran over 20% in the following two weeks without ever looking back.
That one trade paid for months of losses.
That is the power of understanding what is actually happening beneath the surface of price action.
What Is the Undercut and Rally?
In simple terms, the Undercut and Rally is a failed breakdown.
It is a classic shakeout where price dips below a major key level, shakes out the weak holders by hitting their stop losses, and then snaps back above that same level with strength, typically confirmed by volume.
This setup most commonly appears during short-term corrections and pullbacks in otherwise uptrending stocks.
The beauty of it is that it gives you a clean, well-defined entry point with a very tight and logical risk.
Why This Setup Exists: The Psychology Behind It
Before you can trade the U&R with conviction, you need to understand why it happens in the first place. It is not random.
When a stock trades at a key level for any period of time, every trader watching that chart places their stop in roughly the same place: just below that level.
Support levels, moving averages, prior highs turned support, they are all visible to everyone. That means stops are clustered in a very predictable location.
Institutions know this.
Large players who want to accumulate more shares at a better price have a simple playbook: push price briefly below the key level, trigger all those stops, buy the shares that get dumped onto the market, and let price snap back above.
The retail trader gets shaken out at the exact low.
The institution fills their position at a discount. Price then rallies hard because the weak hands have been removed and only strong holders remain.
This is not a conspiracy. It is just how markets work.
And once you see it, you cannot unsee it. The U&R is simply your way of recognizing that flush in real time and positioning yourself alongside the institutions rather than against them.
How to Turn This Into a High-Probability Trade: Add the High Volume Close
The real edge multiplier is combining the U&R with a High Volume Close (HVC).
A HVC marks a level where significant institutional activity happened.
When price later undercuts that exact HVC level, you are triggering the stops of traders who entered on that high-volume candle.
The subsequent rally back above it signals that the institutions are still in control and defending their position.
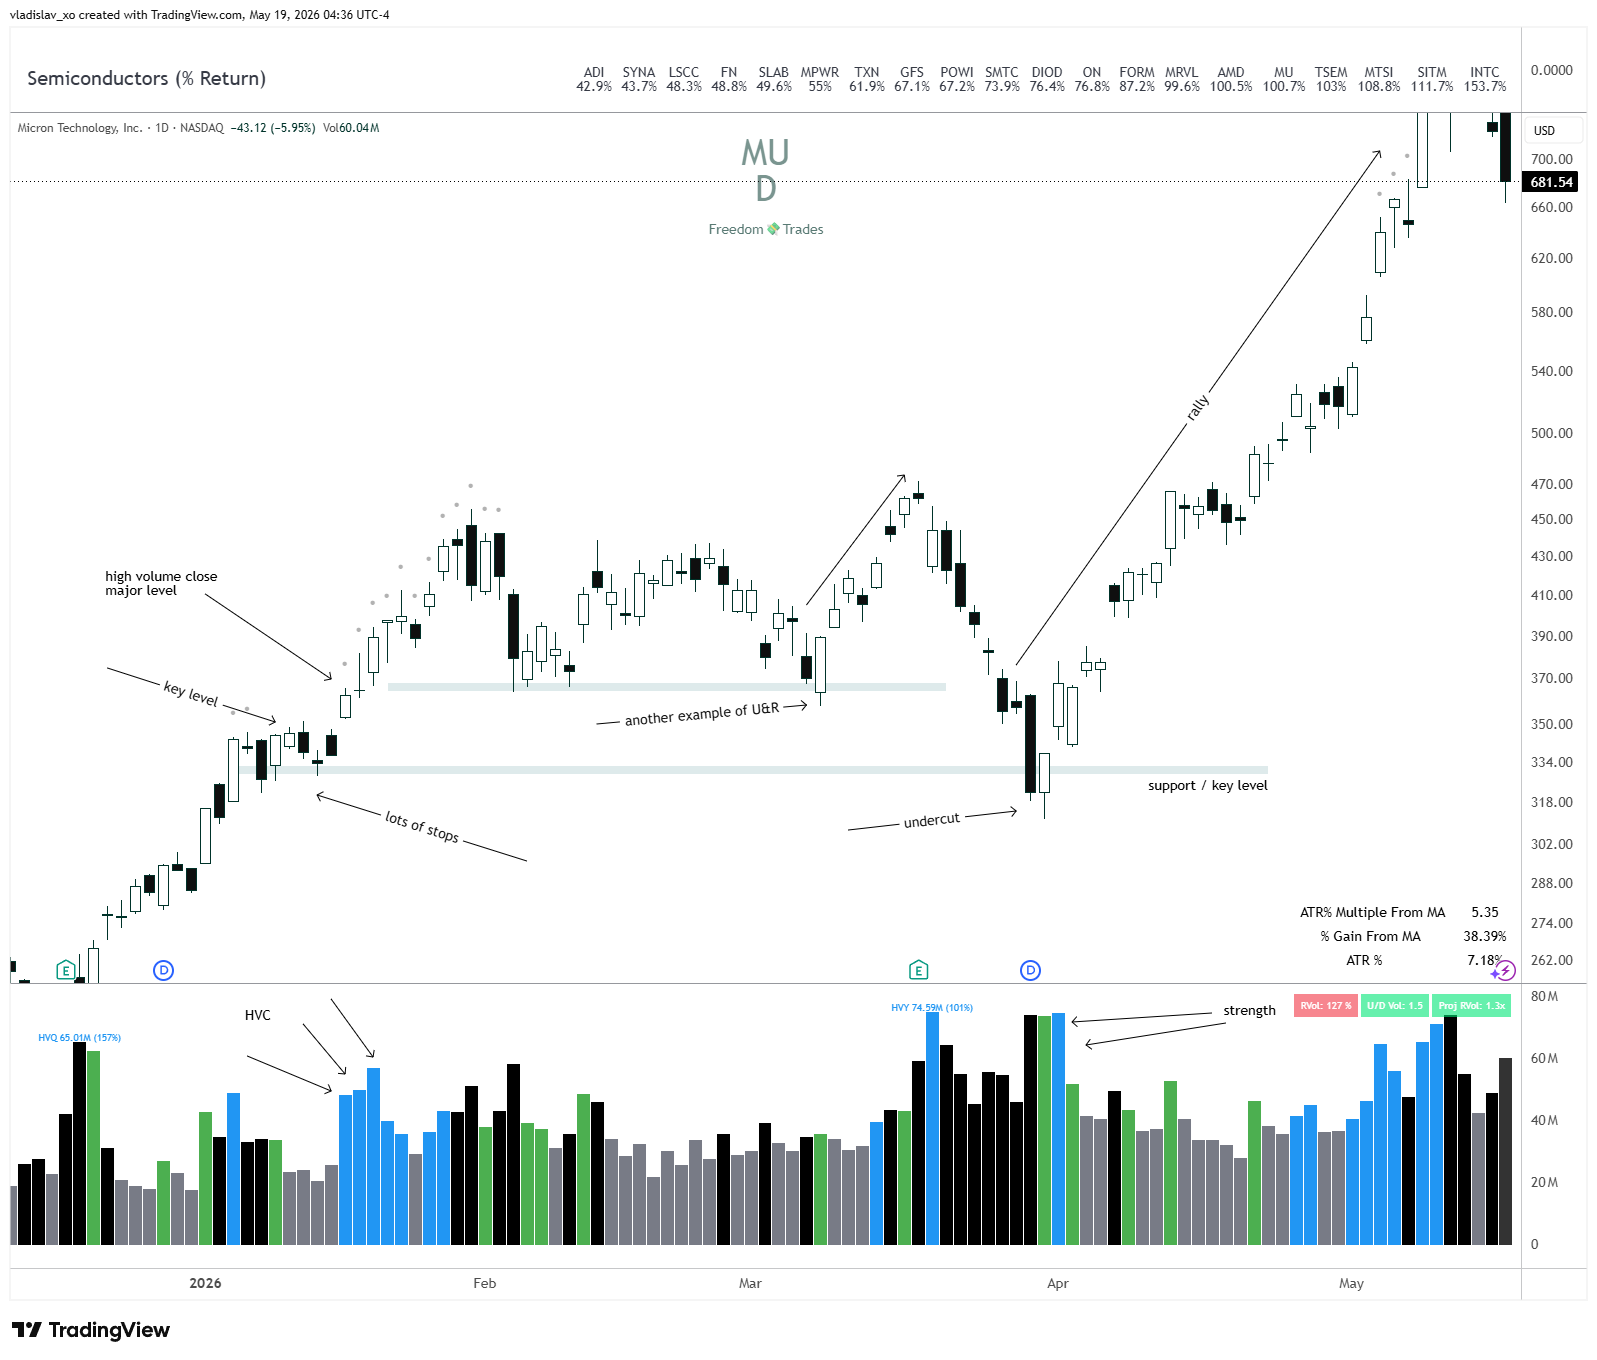
The MU chart is an outstanding example of the HVC combined with U&R.
Multiple High Volume Close candles are annotated at a key support zone around $334 to $370.
Price made an initial U&R at that level (labeled “another example of U&R”), held, and then in April broke down hard, undercutting the key support level.
That undercut shook out the late holders and triggered stops on both sides.
What followed was a clean rally all the way from the lows near $318 back through $540 and beyond, labeled clearly as “rally” and “strength” in the volume panel.
Advanced U&R Technique: Combining the 20 and 50 SMA
The real edge of this setup comes when you layer moving averages on top of each other.
When price undercuts either 20 SMA or 50 SMA.
The more confluence you stack, the higher the probability.
Give more weight to the 50 SMA over the 20 SMA.
The 50 SMA attracts more institutional attention, which means more stops are clustered there, and a successful U&R off the 50 SMA typically produces a stronger and more sustained rally.
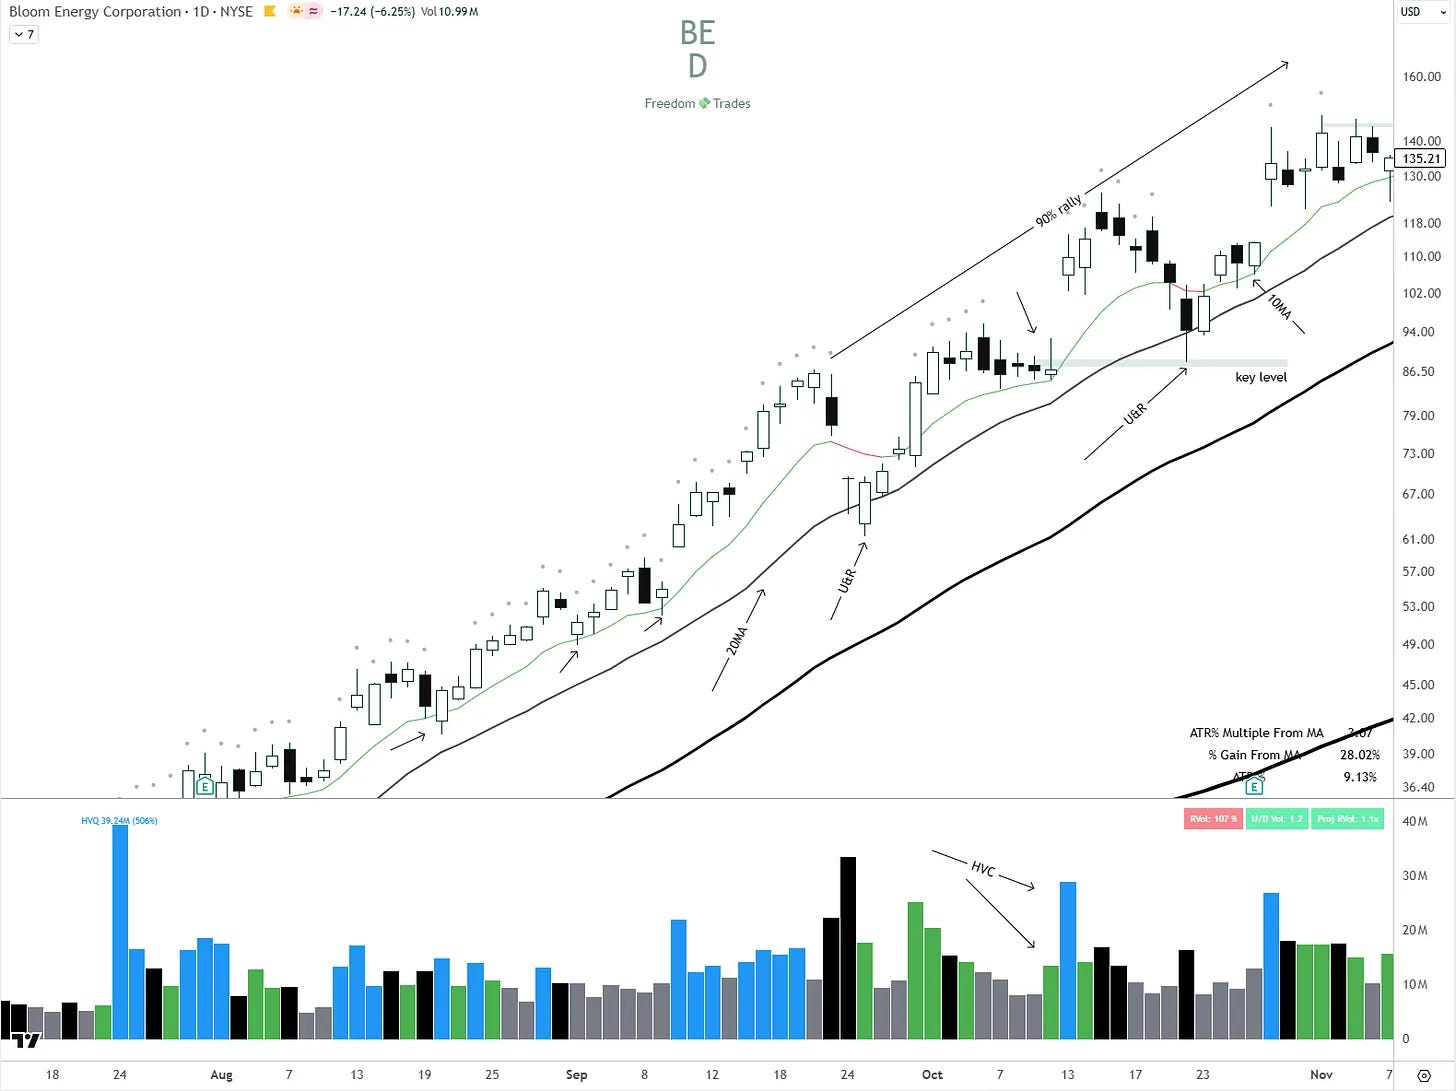
Bloom Energy (BE) is probably the most visually clean example.
The stock trended from the high $30s all the way to $140 in a powerful, uninterrupted Stage 2 uptrend.
Along the way, two separate U&R setups are annotated on the chart.
Each time price dipped below a key moving average or support level, it quickly reversed and continued higher.
The 20 SMA acted as the key trigger, and the rebound from the "key level" around $86.50 produced another powerful rally leg to $140.
The HVC annotations on the volume panel show exactly where institutions loaded up, and each of those levels later became a springboard for the continuation.
How to Play the Undercut and Rally
Once you spot a potential U&R setup, execution is everything. Here is the step-by-step process I use:
1. Identify the key level in advance
Do not wait for the setup to happen and then react.
Mark your key levels before the market opens.
You are looking for prior support zones, high volume close levels, and the 20 or 50 SMA.
2. Wait for the undercut
Price needs to break below the key level with conviction.
This is the shakeout.
Weak holders are getting stopped out.
Do not buy the breakdown. Do not try to catch the falling knife.
Your job at this stage is to watch and wait.
3. Wait for the reclaim
This is your trigger.
You want to see price push back above the key level it just undercut.
The reclaim can happen intraday or on the next candle.
The faster the reclaim, the stronger the signal.
A slow grind back is less convincing.
4. Enter on the reclaim
Your entry is the moment price closes back above the undercut level, or you can enter aggressively as price is reclaiming it if volume is already confirming.
A strong close near the high of the reclaim candle is ideal.
5. Place your stop below the undercut low
This is the beauty of the setup.
Your risk is extremely well-defined.
Your stop goes just below the lowest point of the undercut.
If price goes back down there, the setup is invalid and you exit without hesitation. No exceptions.
6. Set your target based on ATR.
A clean U&R off a key level typically targets the prior high or the next major resistance zone.
Use the ATR of the stock to gauge how much room you have.
As a rule, you want at minimum a 3:1 reward-to-risk ratio before entering.
(revisit our strategy so you know exactly when to sell!!!)
7. Manage the trade as it moves
Once the trade is working, trail your stop behind the 10 SMA or the prior swing low.
If the stock is a strong momentum leader, do not rush to take profits.
Let the position breathe and give the move room to develop.
The best U&R setups on large-cap momentum stocks can run for months.
Here’s an example on NBIS
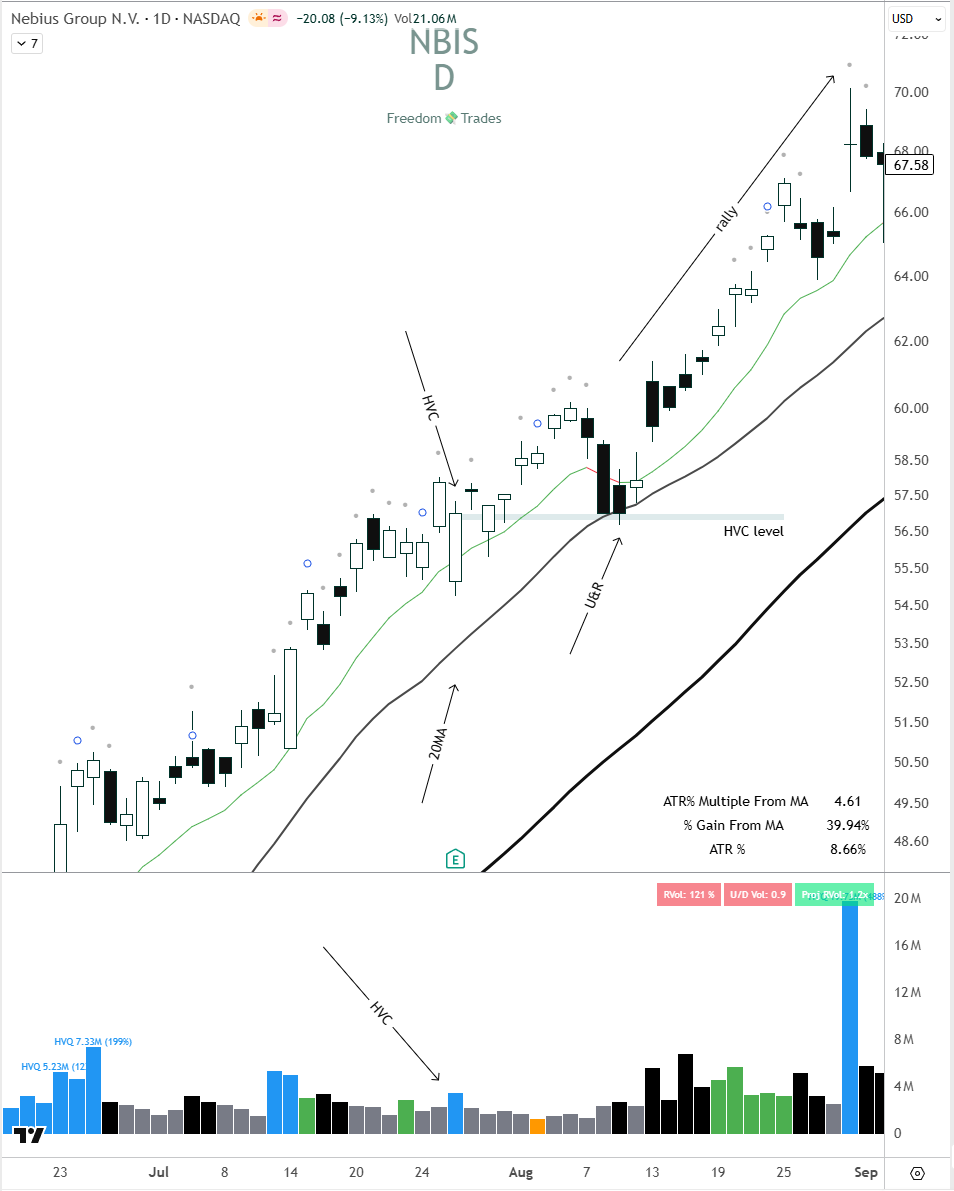
NBIS provides a clean example of a U&R off an HVC level in a strong momentum stock.
An HVC occurred around the $57.50 area, setting a key reference level.
Price later pulled back and undercut that HVC level, then snapped back above it in a textbook U&R.
From that U&R entry, NBIS rallied sharply, reaching near $70 before the most recent pullback.
The volume panel shows the massive spike on the most recent session, which is the current HVC being set now.
This is a stock that had already proven itself as a momentum leader before the setup triggered, which is exactly the criterion you want.
The Core Checklist for a High-Probability U&R
Here is how to stack the edge in your favor before taking any U&R trade:
Price undercuts a major key level (prior resistance turned support, a high-volume close level, or a key moving average)
The undercut is followed by a reversal and reclaim of that level, preferably on the same day or within 1-2 sessions.
Volume on the reversal candle is above average, ideally confirming institutional absorption
The stock is a proven momentum leader with strong prior price action, not a random name.
The U&R aligns with the 50 SMA (weighted higher than the 20 SMA) for maximum confluence.
The undercut level coincides with a prior High Volume Close, making it the most powerful version of the setup.
The bigger the market cap, the more respected these levels tend to be.
Large-cap momentum stocks have more institutional participation, which means more stops are clustered at key levels, and the U&R shakeout is more predictable and more explosive when it resolves.
Want to Go Deeper?
Today’s newsletter gave you the full framework.
But knowing the setup is only half the equation.
The other half is knowing exactly which stocks to watch each week, how to size your position correctly, when to add to a winner, and when to cut and move on.
Inside Freedom Trades, I share my live watchlist every single week, post real-time alerts when I enter and exit trades, and break down every setup I am tracking with full context.
Everything you read today, applied live, every day.
If this newsletter added value to your trading, you will get this level of detail every single day inside the community. Come join us.
And right now, the yearly plan is 49% off.
If you have been sitting on the fence, this is the moment.
Trade Setups of The Week
High Probability Trades for 18-22 May 2026

This week’s PRO report breaks down my full momentum stock watchlist, including the setups I’m watching.
You’ll see my portfolio, my open positions, and the exact stocks I’m targeting.. all based on the same swing trading system.
If you want to trade smarter ,not longer , and get my weekly watchlist with setups, and portfolio breakdowns, this one’s for you.
Copy My Watchlist for this week
Here are the stocks, sectors, or trends I’m watching closely.
Access my entire watchlist for free here:
My watchlist
Want more than just a watchlist?
Get an understanding of the screener, so you know exactly what to watch.
Gain access to my trading strategy!
Join a community of like-minded individuals who are committed to achieving financial freedom and taking control of their future.
Upgrade now to get the full experience!
If you think this newsletter could help your friends, share it with them so it can reach as many traders as possible.
And here’s the fun part: when you share it, you can unlock special rewards + you will look smart in front of your friends :)
“One trade closer to freedom.”
Vladislav
Really helpful article. Thank you