

Weekly EDGE - Stock Market Recap(10-14 March 2025)
The objective of this weekly stock market is to keep you ahead of the game— Episode 4

Dear Investors,
Before we dive in, I just want to say a huge THANK YOU for a
ll the support over the past two weeks. Even though it’s been less than a month since I started, the growth in subscribers and views has been insane. That fires me up to create even more value and build something truly useful for you.
But to do that, I need your help.
I want to know YOU. each and every one of you. reach out! I’m not here to be some guru preaching from a pedestal. I want to build a real community where we get to know each other, grow together, and work toward financial independence while making meaningful connections along the way.
So tell me, how can I make this newsletter better for you?
With that being said let’s start our stock market recap.
Oh, what a week it's been in the financial markets! A rollercoaster ride that left investors clutching their portfolios like safety harnesses.
This week's top stock market news
Trade Wars: The sequel no one asked for
Just when we thought it was safe to go back into the market, President Trump decided to channel his inner tariff artist, slapping duties on imports from Canada, Mexico, and China. This move sent the S&P 500 tumbling 1.8% and the Nasdaq-100 down 2.6%, reminding us all that trade wars are the financial equivalent of stepping on a Lego, unexpected and painfully disruptive.
Tech Stocks: From magnificent to meh
The so-called "Magnificent Seven" tech stocks took a nosedive this week, with Nvidia and Palantir leading the plunge. It seems even AI couldn't predict this downturn, leaving investors wondering if their tech darlings have developed a glitch.
Market Volatility: The new normal
Major U.S. stock indexes closed higher on Friday after a volatile week, with the Dow, S&P 500, and Nasdaq posting their third straight weekly declines. Federal Reserve Chair Jerome Powell's comments about the economy's resilience provided some comfort, but investors remain cautious amid ongoing uncertainties.
Key economic events to watch next week
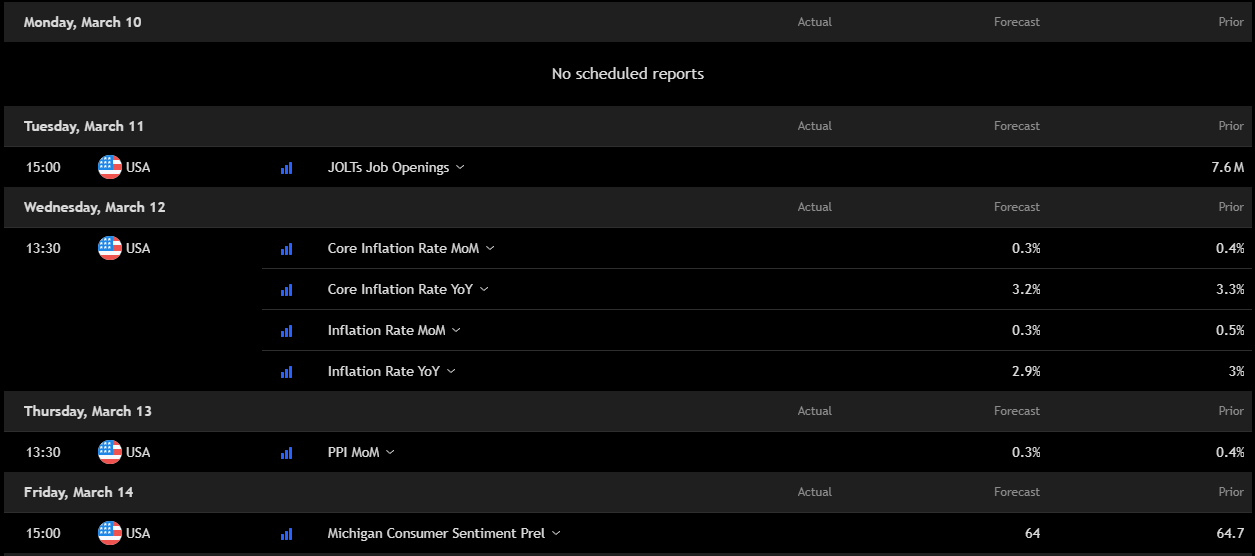
Next week’s economic calendar is packed with key data that could move the markets. On Tuesday, JOLTs Job Openings will provide insight into labor demand.
Wednesday brings critical inflation data, with Core CPI and overall Inflation Rate reports—both closely watched by the Fed.
Thursday’s PPI report will highlight producer price trends, while Friday’s Michigan Consumer Sentiment survey will gauge consumer confidence.
Traders should brace for potential volatility, especially around inflation numbers.
Earnings to watch - Who’s making money?
Here are some interesting earnings reports coming up:
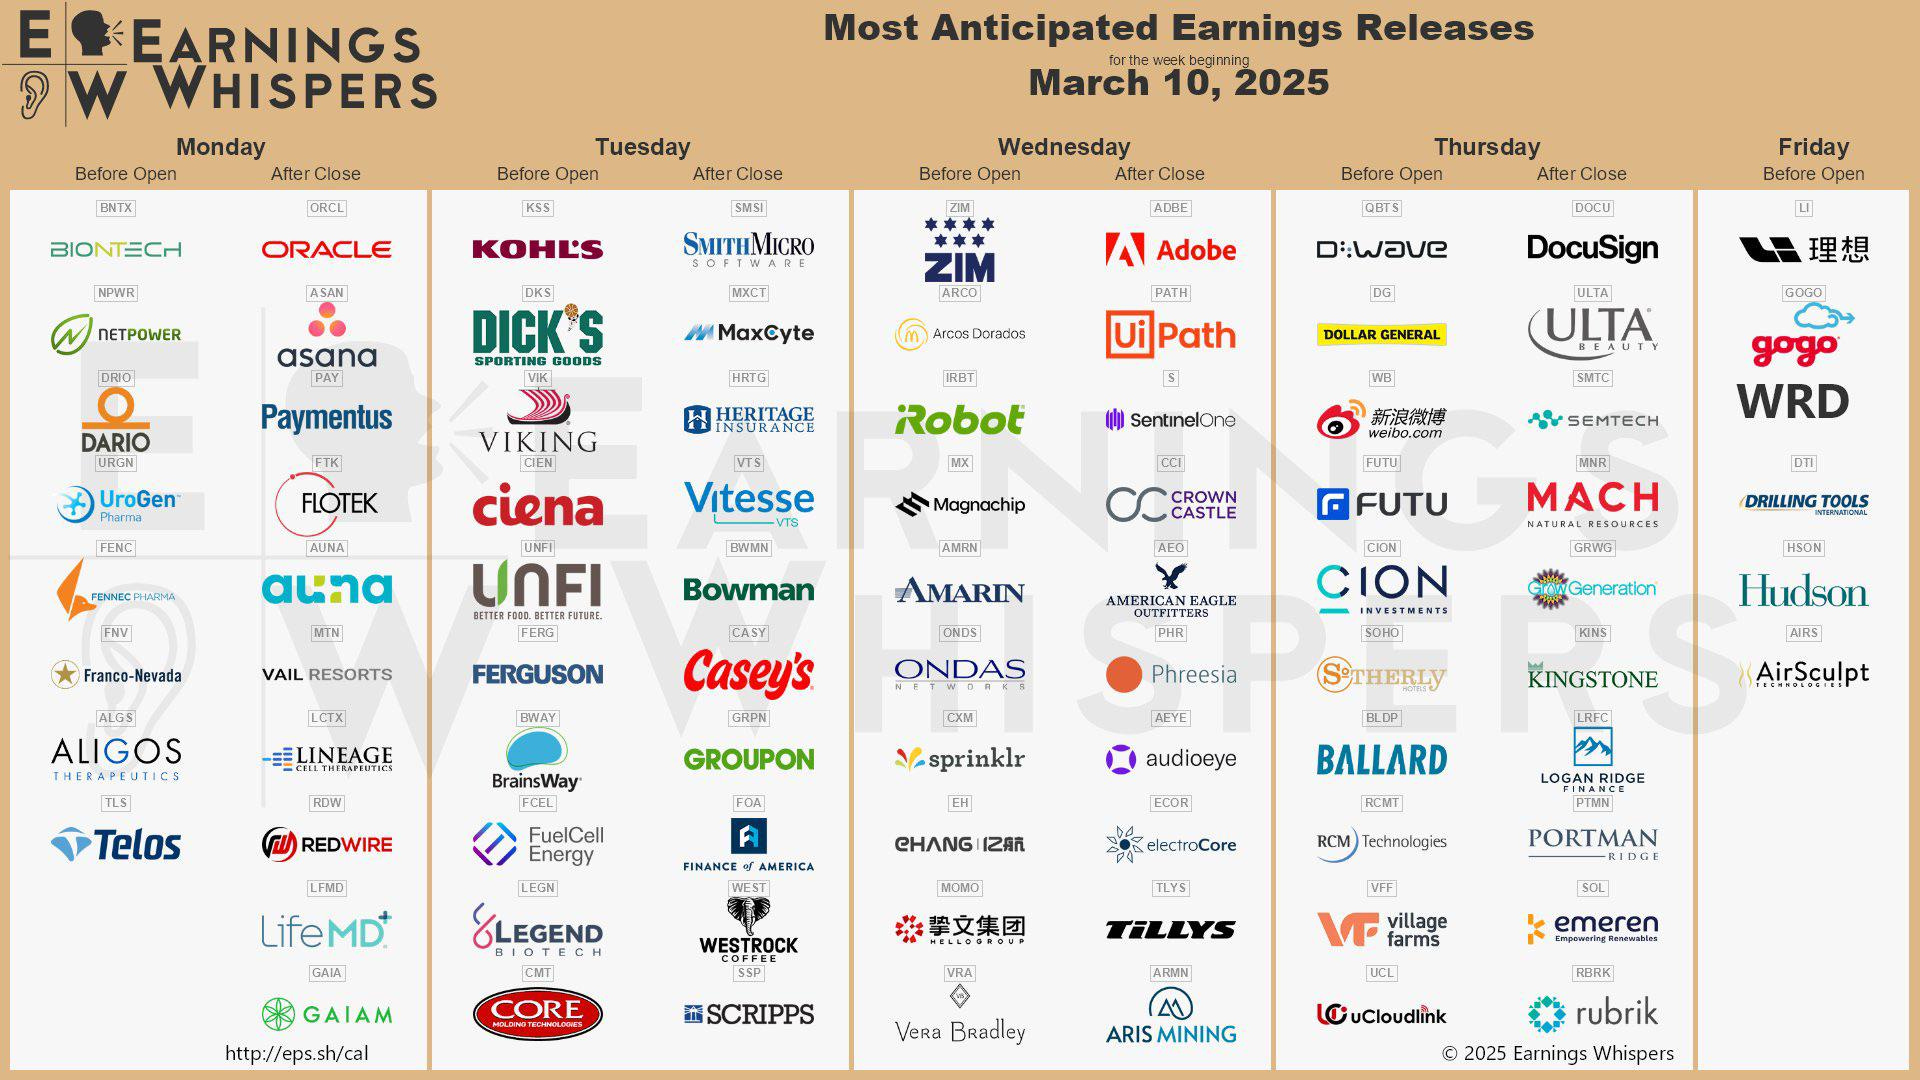
Which earnings report are you watching closely this week? Drop a comment and share your predictions!
My Watchlist for next week
Here are the stocks, sectors, or trends I’m watching closely:
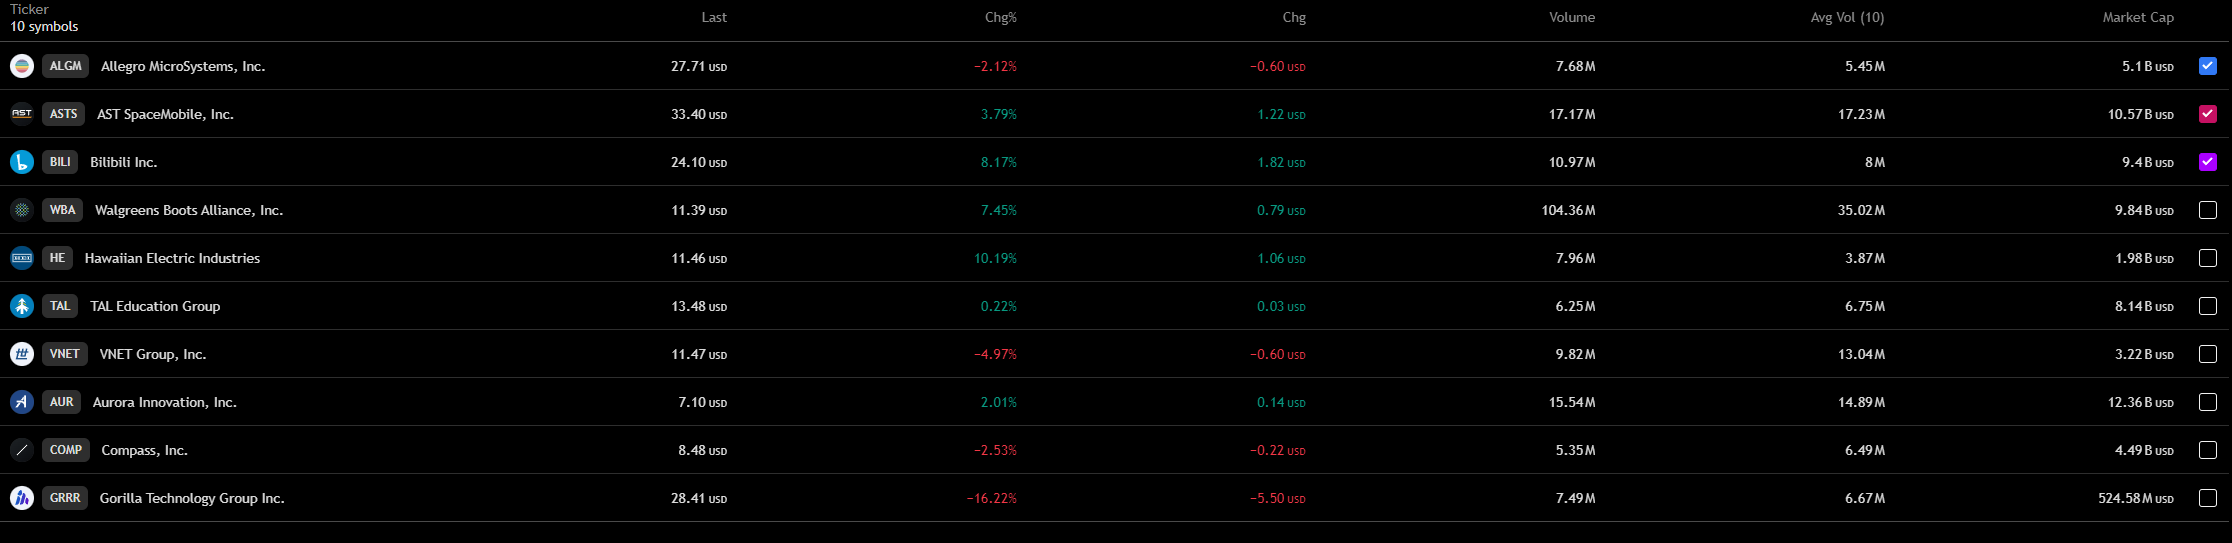
Get exclusive market insights—access my free watchlist now!
🔗 Check it out here: TradingView Watchlist
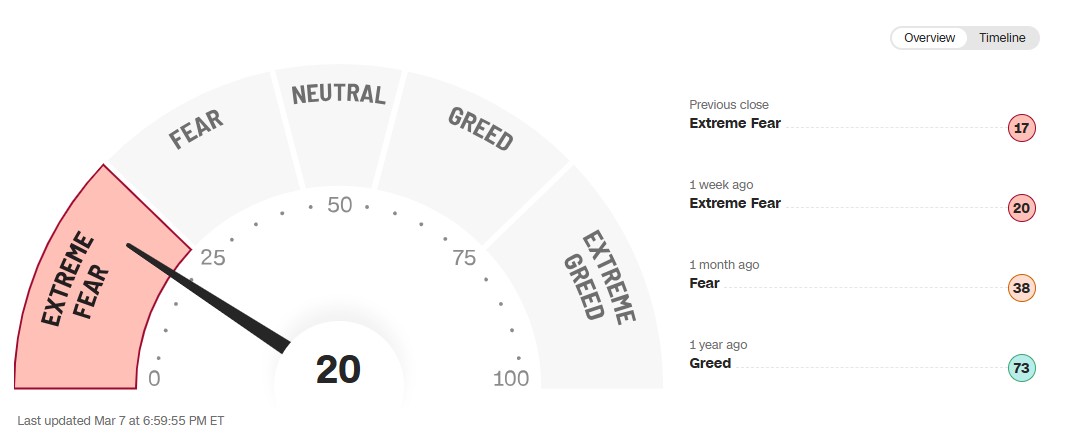
Fear & Greed Index
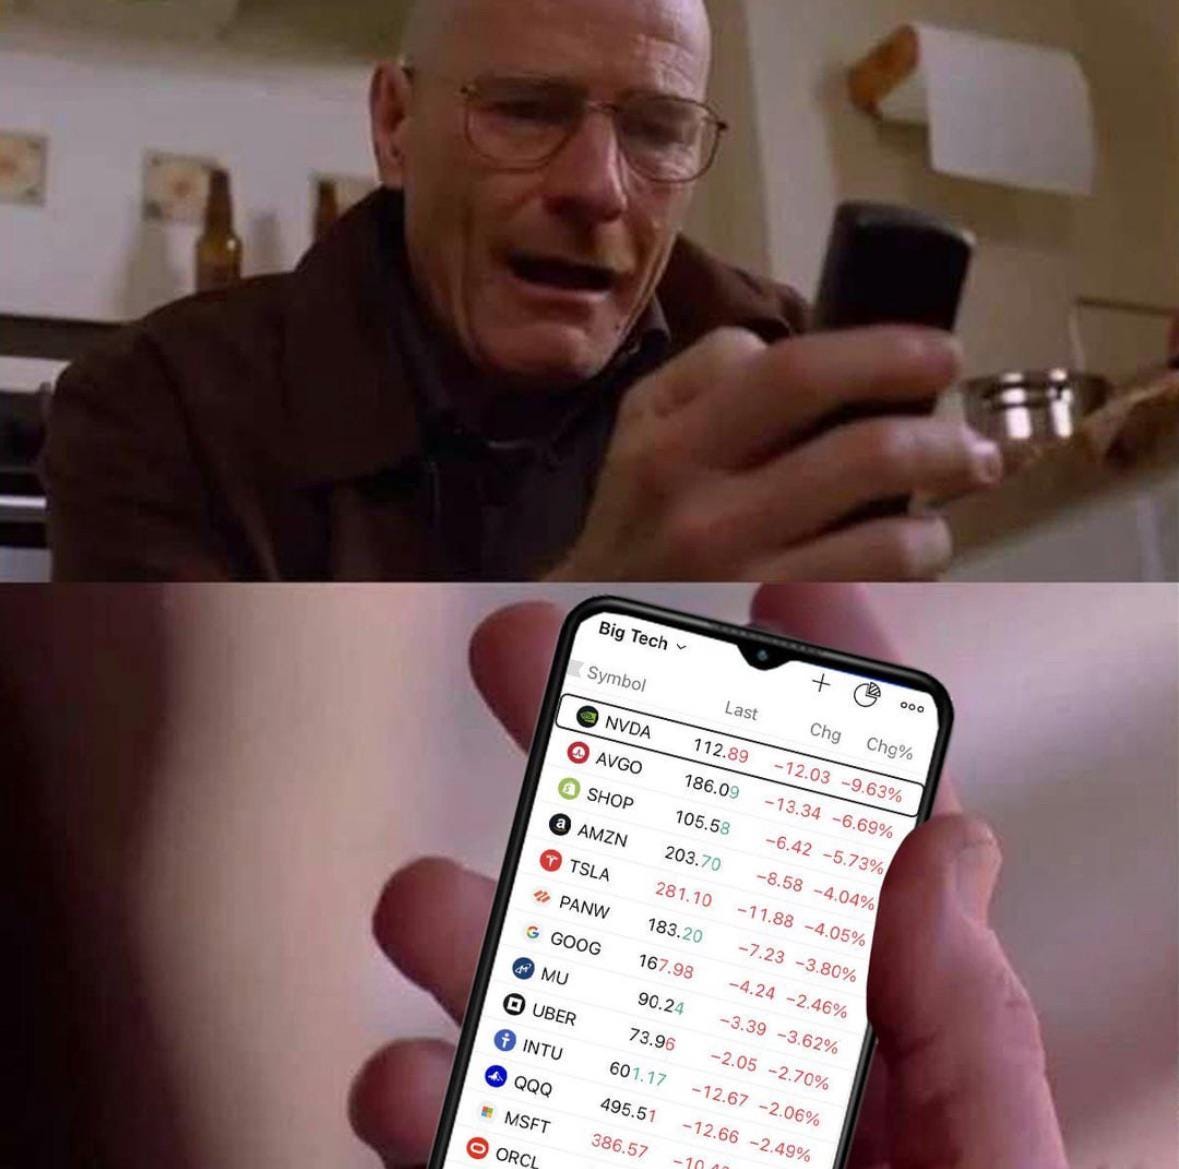
Meme of the week
Crypto
Today we have a special edition brought by CryptoFolks :
Let’s check together what lies on the right side of the chart! To do this, I will present potential scenarios that could end the bull market and the final price levels of cryptocurrencies such as Bitcoin and XRP.
Let's start with Bitcoin.
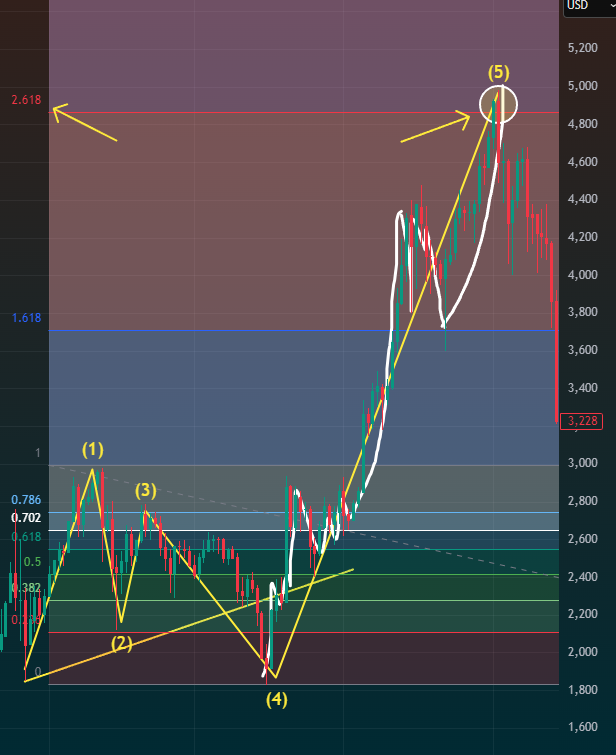
take a look at the chart of BTC from 2017 (above). As you can see, moving from the left side, we observe a price stagnation, which ends with a significant correction, breaking through the yellow support line and then breaking above the 0.702 Fibonacci level—where we experienced another stagnation.
Then, we witnessed the first parabolic move, which ended with a short-term pullback to make way for the second and final parabolic rally. Notice the 2.618 Fibonacci level, marked by a yellow arrow in the top left corner of the chart—this is where Bitcoin peaked! It’s essential to keep this in mind.
You might be wondering what these yellow numbered lines mean—these are Elliott waves, which help us predict future price movements. As seen in 2017, the waves formed in a way that after wave 4, we could anticipate the start of an uptrend—and that’s exactly what happened.
Now, let’s look at the current situation (see the chart below).
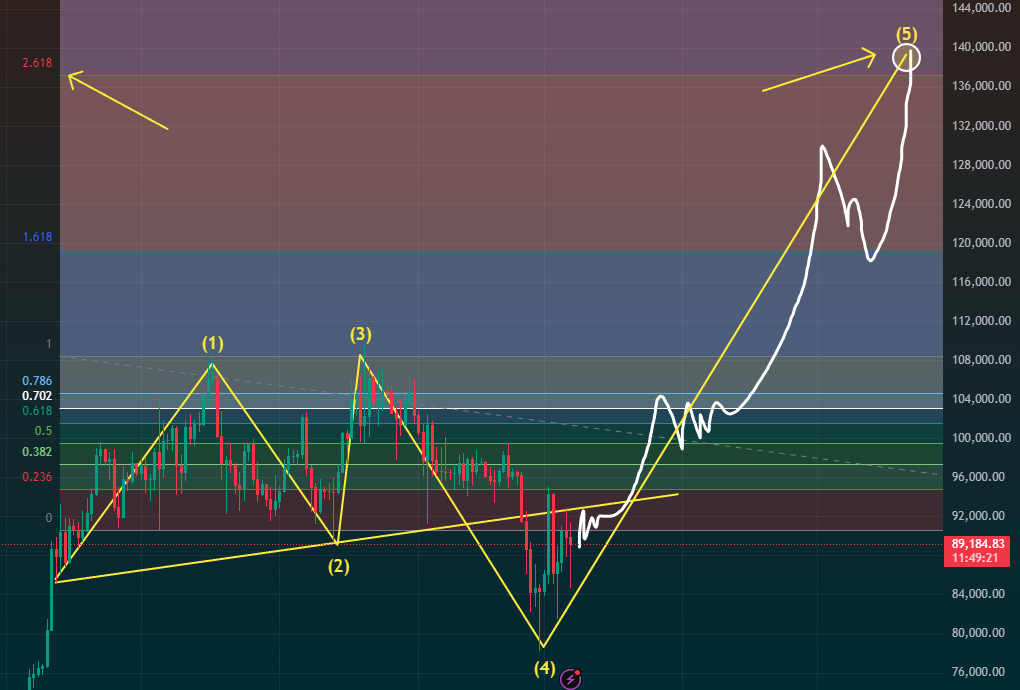
You’ll likely notice an almost identical pattern, and we are currently battling to break through resistance from below. According to our scenario, this should result in the first strong upward move. The expected further development is marked in white.
Take note: Elliott waves align almost identically with those from 2017, suggesting the beginning of a strong rally to levels around $140K, which corresponds to the 2.618 Fibonacci level.
Moving on to XRP,
where the scenario explains why the price could reach up to $8!
Look at the chart below, showing XRP in 2017 (left side) vs. XRP from two weeks ago (right side).
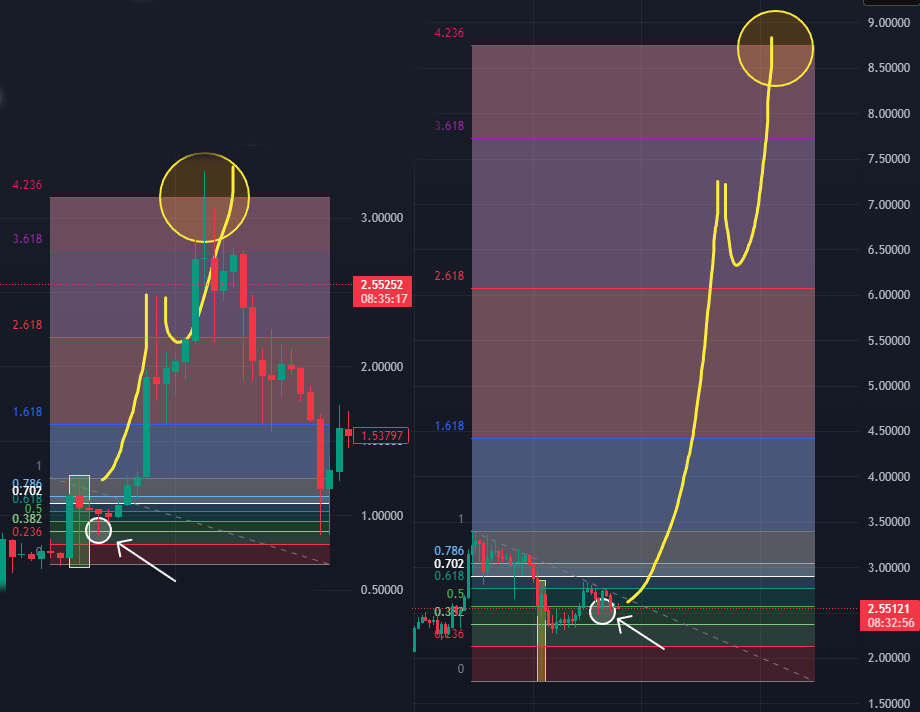
Following a correction triggered by tariffs imposed by Donald Trump, we experienced stagnation and slight declines, which ultimately led to the first major upward wave. Then came a pullback, followed by the final parabolic rally to the 4.236 Fibonacci level.
A very similar situation is unfolding right now! If you’re wondering whether recent events have disrupted this pattern—not at all! Why? Because XRP is currently playing out an accumulation phase, specifically after the “SPRING” phase, which historically led to an uptrend (see the chart below).
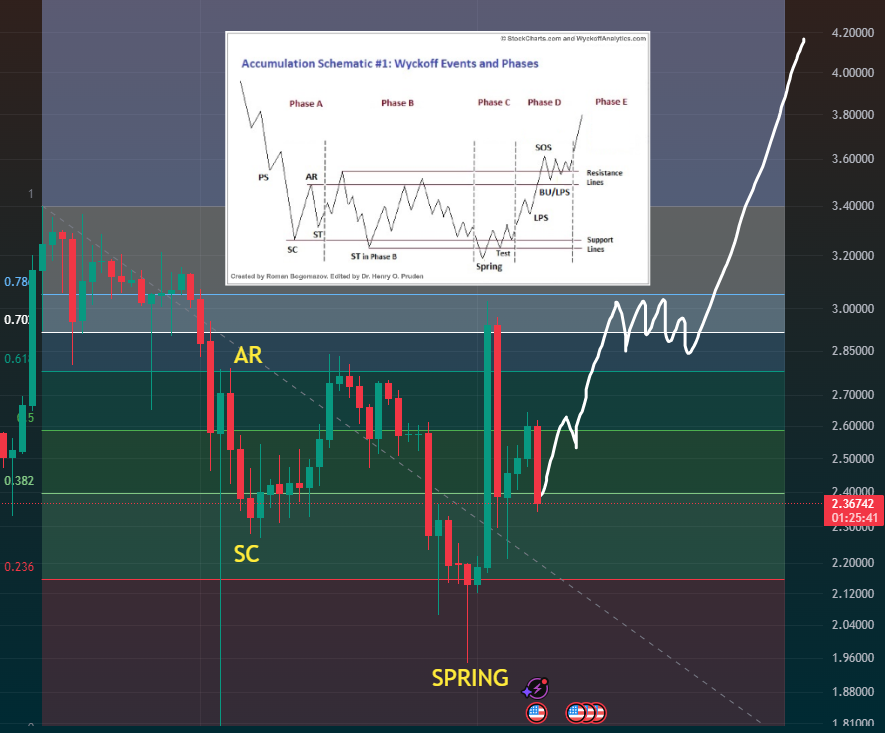
Another strong argument supporting XRP reaching $8 is the Elliott wave formation shown in the next chart. If we overlay this pattern on XRP’s entire price history, the 5th wave aligns with a price of up to $11, providing even more optimistic forecasts for a major XRP surge!
Final takeaway: Both Bitcoin and XRP show historically proven patterns that could signal massive price increases.
Final Thoughts
This week, we hit 108 followers!
As promised, this newsletter is evolving into a must-read weekly publication designed to land in your inbox with one goal: helping you make money.
As the community grows, I’ll be adding new features, including precise entry and exit signals for trends and much more. The best way to stay ahead? Stay engaged, follow the newsletter weekly, and don’t hesitate to reach out.
Welcome to the community. this is just the beginning!
Commenting first for my friend so others comment too. Thanks for the write-up!
Keep those charts coming!