


Most traders hold too long.
They watch the stock extend, feel the euphoria, and convince themselves it will keep going… until a big chunk of their open profits disappears.
By the time you finish reading this, you will know exactly when to start selling a winning stock.
No more guessing. No more giving back gains.
This isn’t theory or personal opinion.
A researcher named Denis Hamel ran a 13-year backtest across 5,506 U.S. stocks, covering nearly 50 million stock-days from 2012 to 2025.
He asked one simple question: how far above the 50-SMA do stocks actually extend, measured in ATR?
The numbers are brutal… and they should change how you manage every winner from now on.
Here’s what we’re going to cover:
The full distribution of extreme ATR extensions (and where almost 70% of them die)
Exactly how to use those numbers for your exits (trim levels at 7, 8, 9 and 10+ ATR)
A simple way to apply this on any chart in under 10 seconds
A high-probability bonus setup that turns the same data into parabolic shorts
What is ATR and what does “extension above the 50-SMA” actually mean?
Before we look at the numbers, let’s make sure the two concepts we’re using are crystal clear.
50-SMA
The 50-day Simple Moving Average is just the average closing price of the last 50 days.
It shows the medium-term trend.
ATR (Average True Range)
ATR measures how much a stock usually moves in a day.
If a stock has an ATR of $2, it means that on a normal day it moves about $2 up or down.
ATR extension above the 50-SMA
This simply answers the question:
“How many normal daily moves is the stock currently above its 50-day average?”
Example:
Stock price = $100
50-SMA = $90
ATR = $2
The stock is $10 above the 50-SMA.
$10 ÷ $2 ATR = 5 ATR above the 50-SMA.
That’s it.
The higher this number, the more stretched (and statistically dangerous) the move becomes.
Now that you understand the language, the data below will make perfect sense.
What the Numbers Show
Here is the full distribution of extreme ATR extensions above the 50-SMA:
7 ATR: 11,436 days (69.4%) across 1,316 stocks
8 ATR: 3,662 days (22.2%) across 760 stocks
9 ATR: 967 days (5.9%) across 275 stocks
10 ATR: 281 days (1.7%) across 82 stocks
11 ATR: 49 days (0.3%) across 18 stocks
12+ ATR: 87 days (0.5%) across 21 stocks
Read those numbers carefully.
Out of every 100 times a stock reached an extreme extension above the 50-SMA, almost 70 of those times it stopped at 7 ATR.
Only 22 made it to 8.
Less than 6 made it to 9.
The odds of continuation drop dramatically with each level.
What This Means for Your Exits
The moment a stock reaches 7 ATR above the 50-SMA, you are statistically in a zone where most extensions end.
That does not mean you sell everything.
It means you start trimming.
Here is how I think about it:
At 8 ATR: Trim at least 20-30% of your position. The odds are stacked against further extension.
At 9 ATR: You are now in the top 6% of all extreme moves. Tighten your stop aggressively or unload a big chunk.
At 10 ATR and beyond: You are in rare air. Less than 2% of extreme moves ever get here. If you still have a full position, you are gambling, not trading.
The goal is not to catch the absolute top.
The goal is to protect the majority of your gains while the probabilities are still in your favor.
The Real Edge Is in What You Keep
The edge comes from how you manage the trade once it is in your favor.
A stock up 8 ATR above its 50-SMA has already done the hard work for you.
Your job at that point is not to get greedy. Your job is to lock in the majority of that move before the odds flip.
Think about it this way: if 69% of extreme extensions stop at exactly 7 ATR, and you consistently hold through that level looking for more, you are going to give back a large chunk of your open profits on most trades.
Over hundreds of trades, that adds up to a significant drag on your equity curve.
Trim early, trim often at extended levels, and let a small runner go for the outlier move.
That is how you stay consistent.
How to Apply This to Your Trading
You do not need a 50-million-day dataset to use this.
You just need to know where your stock is relative to its 50-SMA, measured in ATR.
On TradingView, this is straightforward to calculate or script.
You can get the indicator here (it’s completely free): https://www.tradingview.com/script/oimVgV7e-ATR-multiple-from-50-MA/
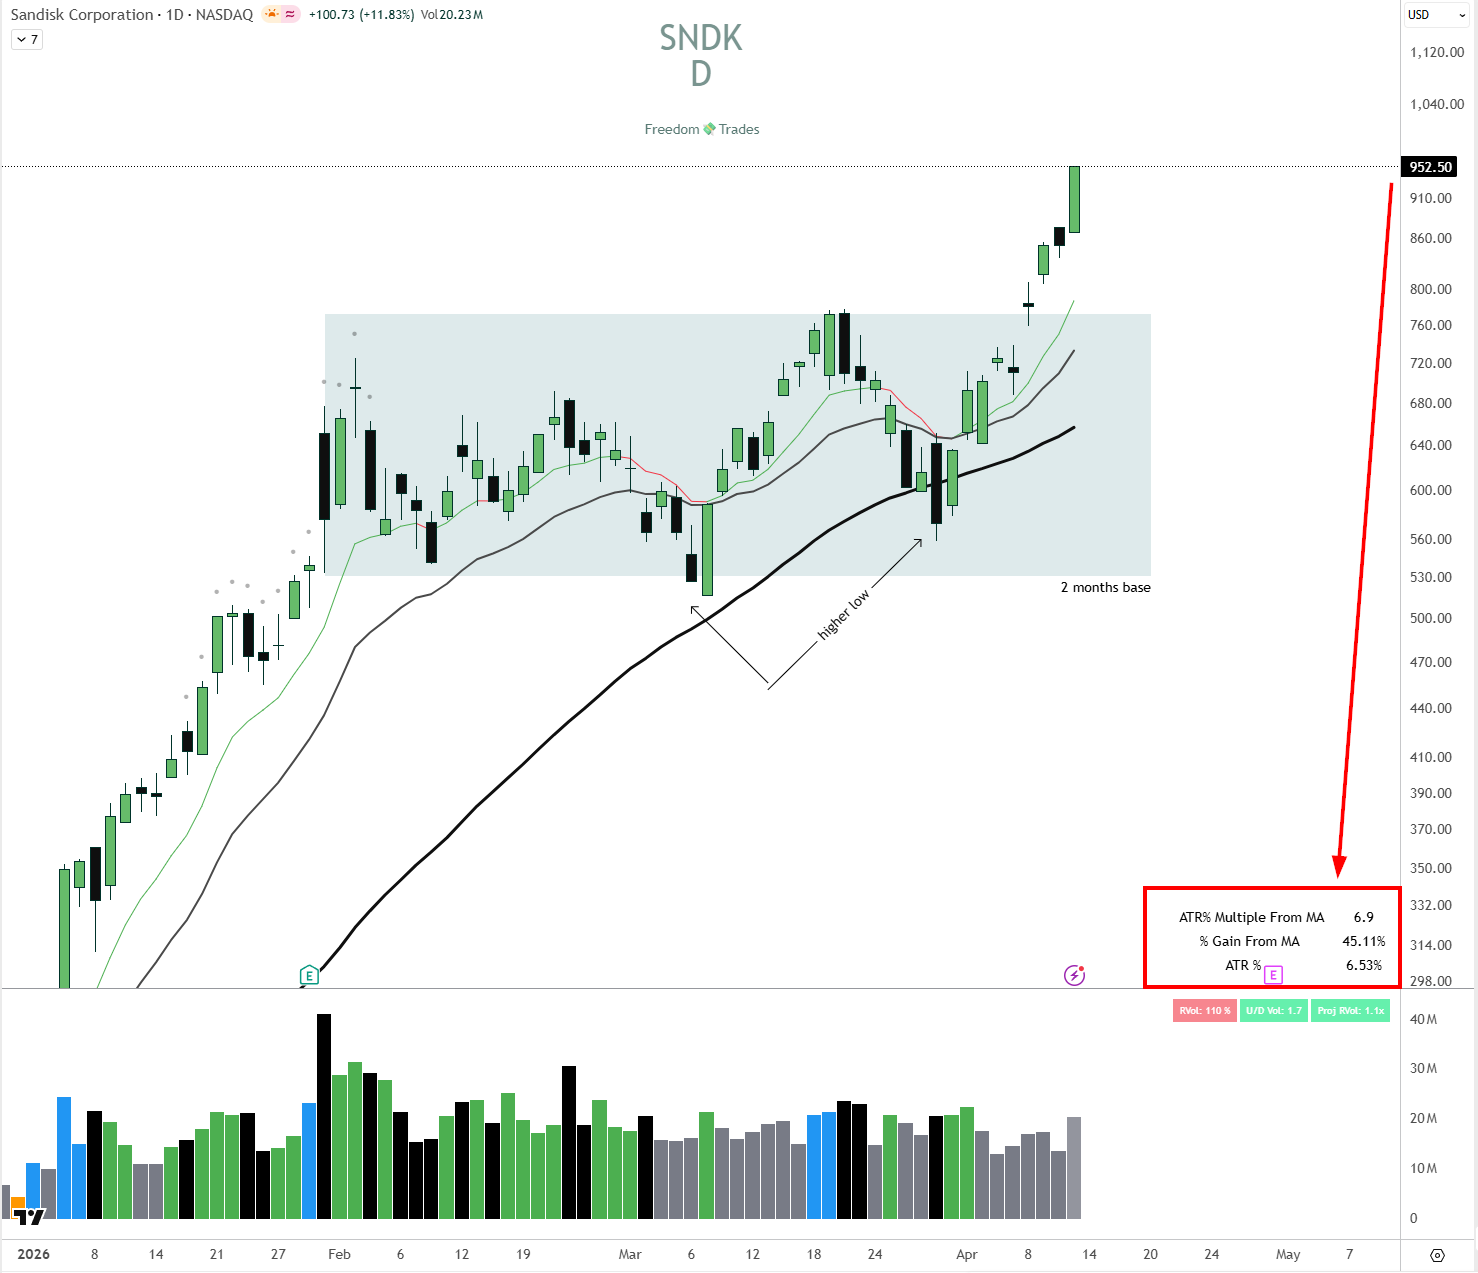
Once you have that number, the rule is simple:
7-8x ATR above the 50-SMA = start trimming, no exceptions.
The data does not care about your conviction.
It does not care how good the chart looks.
It just tells you that 69% of the time, this is where the extension ends.
Use that information.
Join 2,000+ traders
For less than $0.80/day, unlock a proven swing trading strategy, real-time trade alerts, and access to a private Discord community.
BONUS - Transform the ATR Extension into a Short Setup
Just as this data tells you when it is time to trim a long position, you can also use it as an indicator for a setup called the Parabolic Short.
This is a very high-probability trade, but it needs to be managed right.
Here are a few examples.
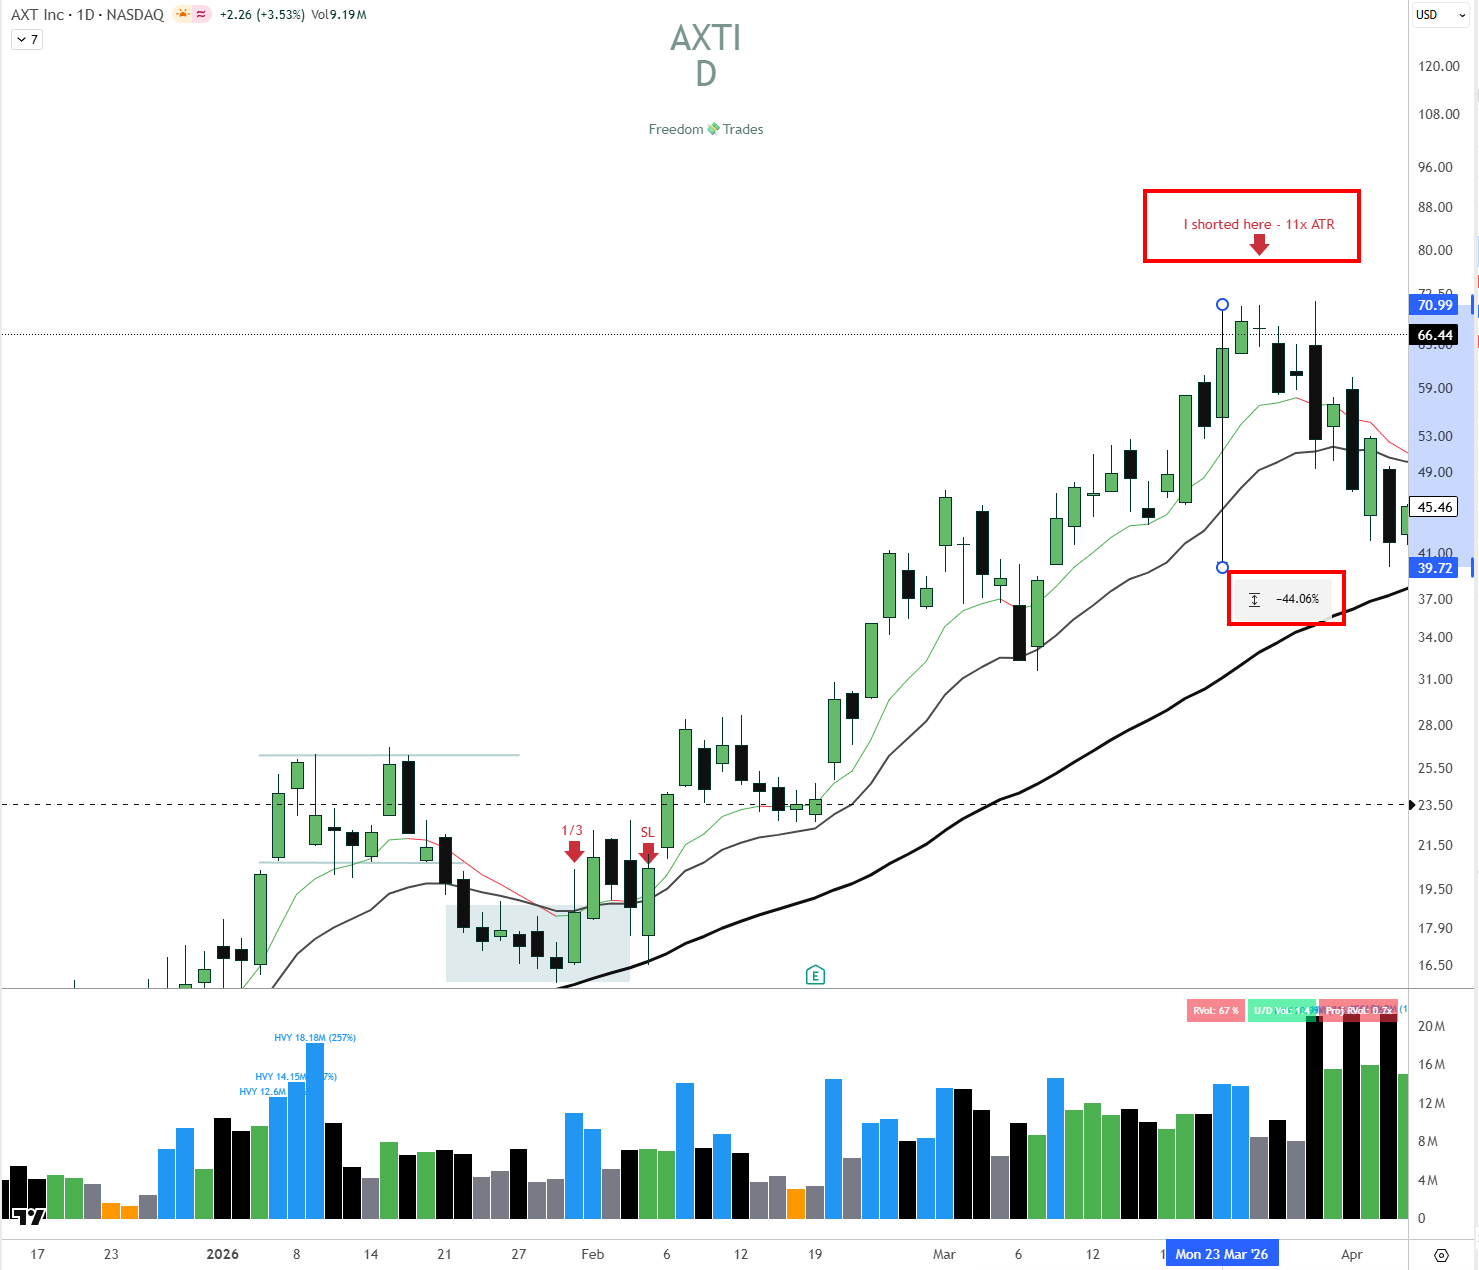
AXTI showed 11x ATR above the 50-SMA. Guess what happened next. It dropped 44%.
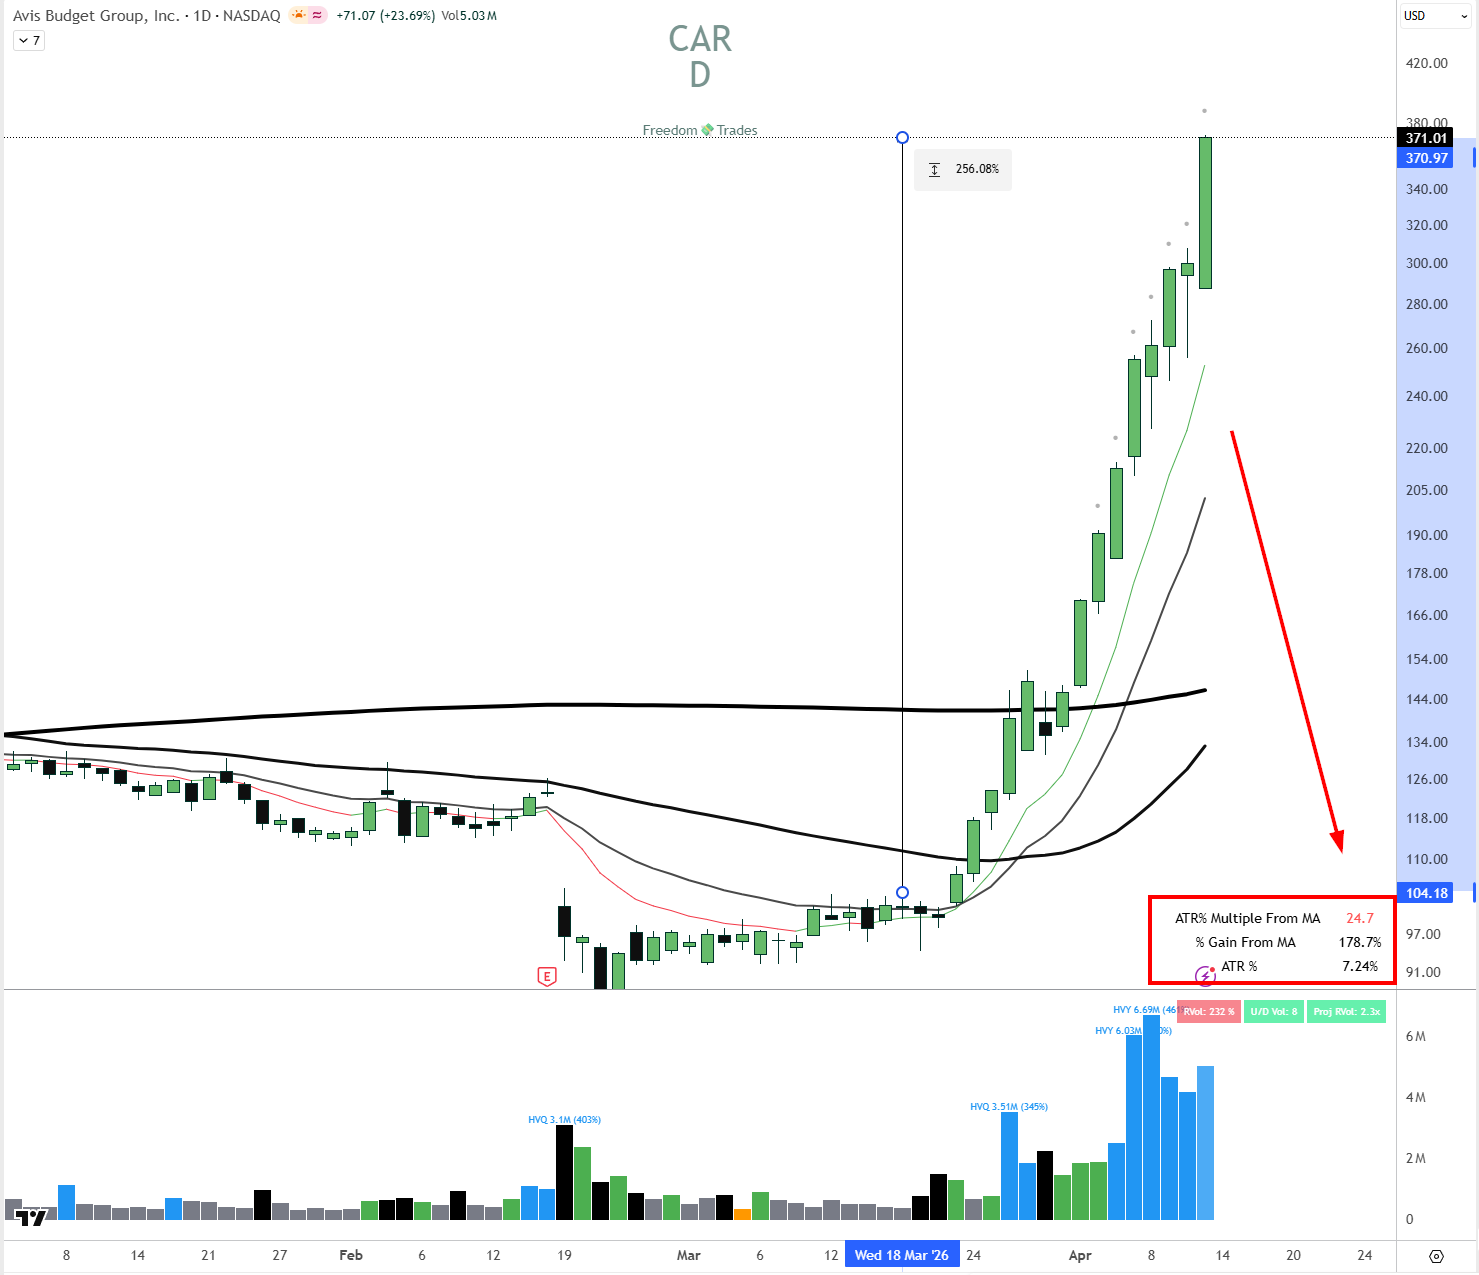
At the time of writing this, CAR is sitting at a 24.7x ATR multiple above the 50-SMA.
What do you think happens next after 15 green candles and just one red one?
Here’s the answer:
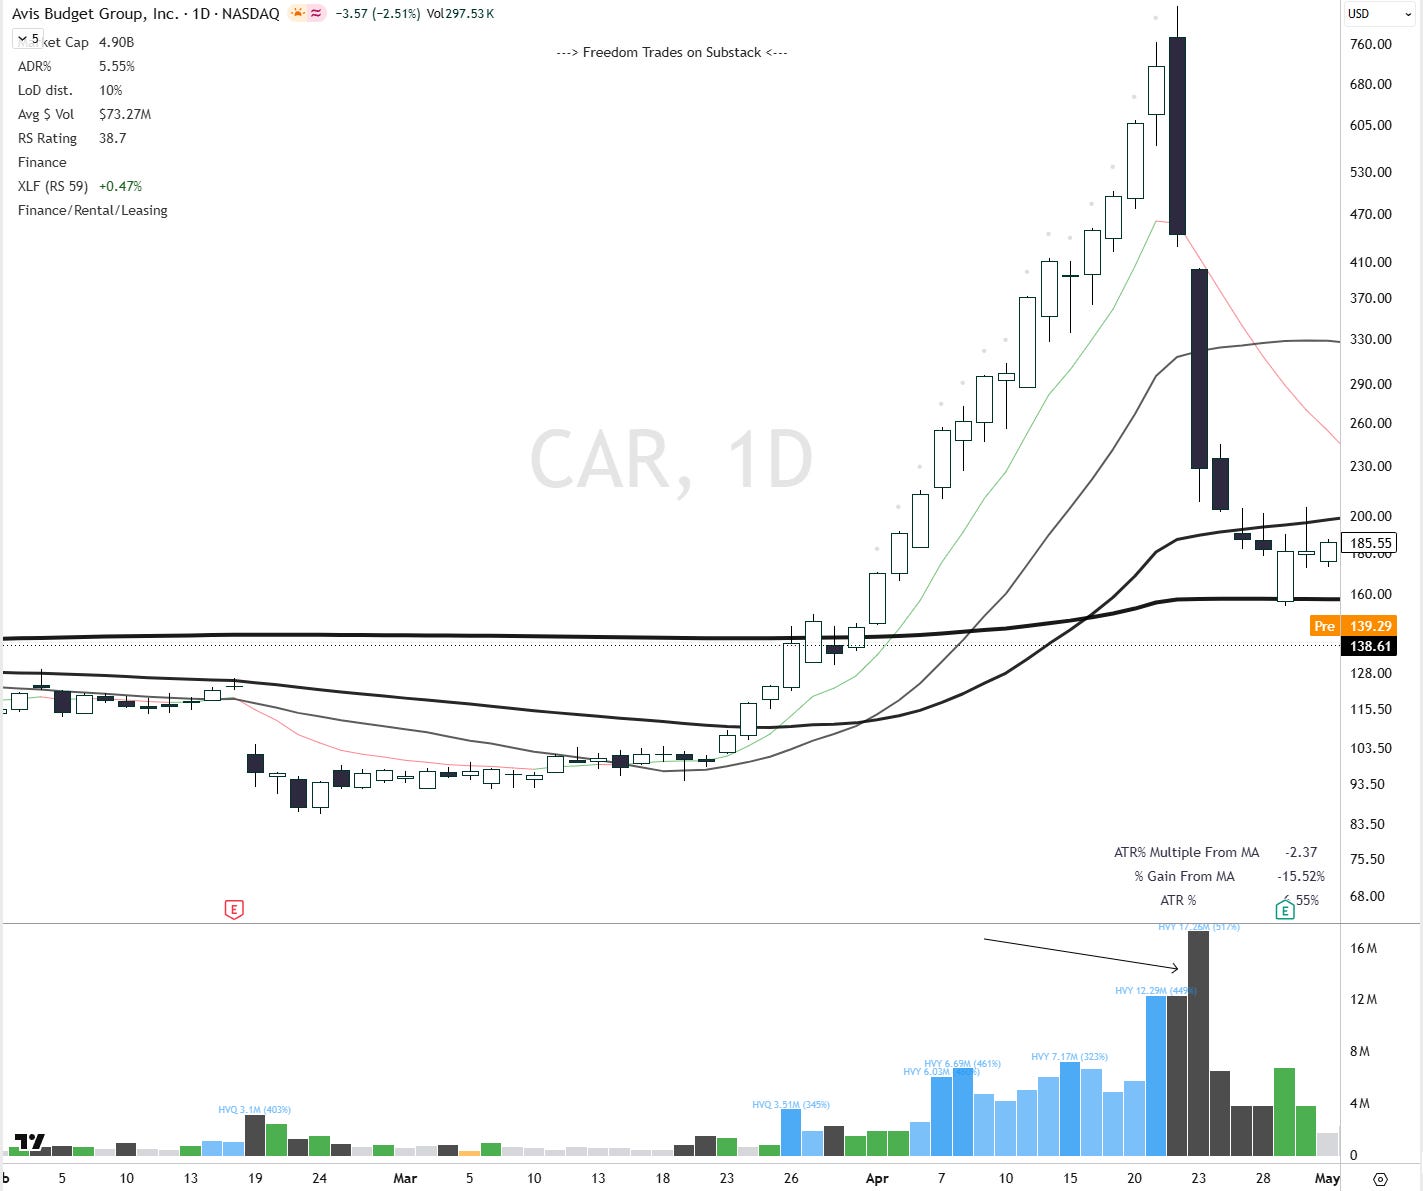
82% drawdown.
The data is clear.
Most extensions die at 7 ATR.
If you want more frameworks like this, real-time examples, and a community of traders who actually manage winners the same way, join the Pro community.
And right now is the best time to do it.
The yearly plan is 49% off.
Trade Setups of The Week
High Probability Trades for 10-14 August 2026

This week’s PRO report breaks down my full momentum stock watchlist, including the setups I’m watching.
You’ll see my portfolio, my open positions, and the exact stocks I’m targeting.. all based on the same swing trading system.
If you want to trade smarter ,not longer , and get my weekly watchlist with setups, and portfolio breakdowns, this one’s for you.
If you think this newsletter could help your friends, share it with them so it can reach as many traders as possible.
And here’s the fun part: when you share it, you can unlock special rewards + you will look smart in front of your friends :)
“One trade closer to freedom.”
Vladislav
I like using extension as a state variable rather than relying on “this feels overbought.” I’d be cautious making 7 ATR a universal rule, though ... regime, liquidity and the stock’s own volatility structure still matter. The useful shift is that once a move enters statistically rare territory, the burden of proof changes from “why sell?” to “why am I still holding full size?”
Excellent article!
I saw that “Edition 80” below the title , do you have a whole series about this?