


Today I’m going to show you the simplest setup you can master as a beginner.
A setup used by legendary traders such as William O’Neil, Mark Minervini, Quallmagie, Ariel Hernandez, Gill Morallis, and many other USAC champions.
This setup is called the Flat Base Breakout.
What is a Flat Base Breakout?
A Flat Base Breakout is a technical analysis signal that occurs when an asset’s price breaks above the resistance level of a long, tight sideways consolidation period.
It often indicates that buyers have absorbed available supply and that the stock may be ready to begin a new upward move.
Here’s what it should look like in theory, and below I’ll show you some real-life examples.
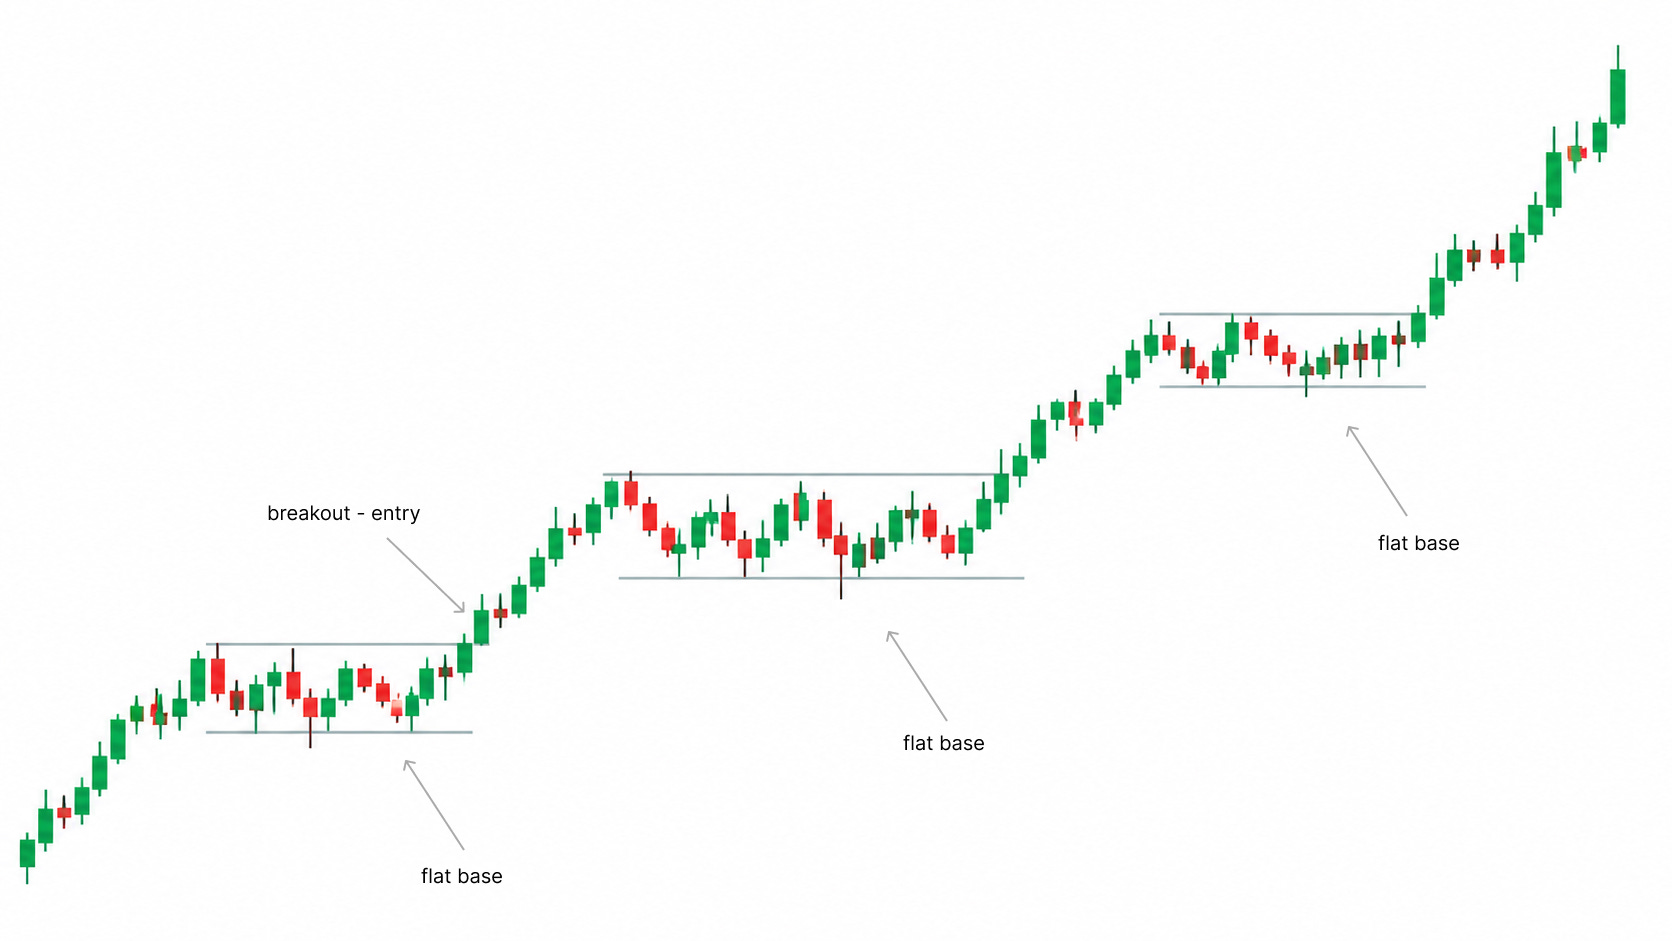
How to Identify a Flat Base on a Chart
To identify it on a chart, you need to look for:
Sideways consolidation within a tight range. Generally, you want to see a stock moving sideways, typically within a 20% range from the highest to the lowest point.
But that’s not enough!
There are some clear criteria that increase the likelihood of a monster trade!
A prior move of at least 40% or more is required.
Before this accumulation zone (sideways price action) forms, a strong upward move is needed. And this base will represent the consolidation period.
The duration of the base must be at least 4 weeks.
There’s a reason for the saying, “the bigger the base, the higher the upside.”
The reason a minimum of 4 weeks is needed is to give the stock enough time to digest this 40% or greater move.
During this period, it also weeds out the weak holders because many investors will be late to the move and will get caught up in this choppy trading, leaving them mentally and financially exhausted.
During this consolidation period, the price, from the highest point to the lowest, should not fall by more than 20%.
You don’t want a stock with erratic movements, you want to see relative strength and that the stock manages to hold its price.On the day of the breakout, you want to see at least 1.5x Relative Volume.
This increased volume indicates strong demand from those driving the price, the big money (institutional buyers), which will increase your likelihood of a successful trade..
Examples of a Flat Base Breakout
Many people, myself included, learn better visually, so I’ve prepared a few examples of successful flat base breakouts, and below we’ll also discuss failed base breakouts.
What I’m going to show you below is a real trade I made in HPE that ended up yielding a return of approximately 100% before I sold it. (I entered the trade on April 16, 2026.)
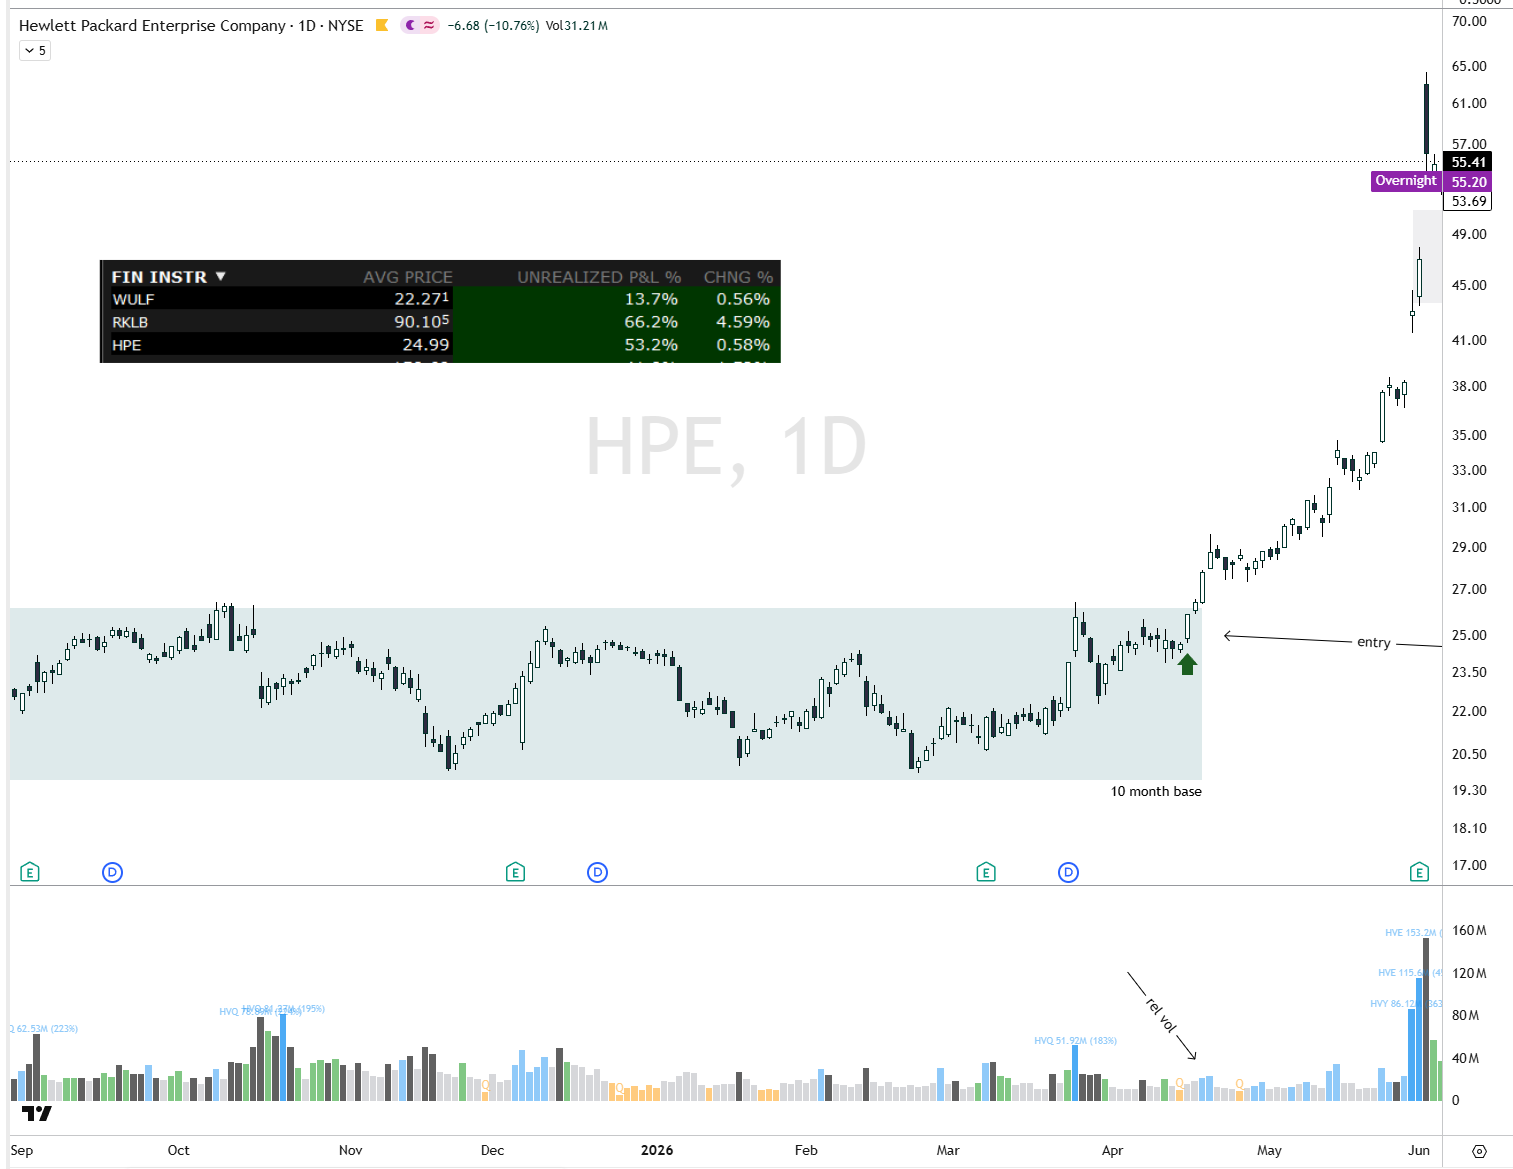
As you can see, HPE had all the right ingredients.
It had moved about 70% before entering a 10-month consolidation phase.
The base lasted 10 months.
The range from the highest point to the lowest was a maximum of 25%.
At the time of entry on that day, the Rvol was over 1.5x.
And if you look again, HPE began to form another base after this move of over 100%. But something is different, this time, the price is much more erratic. (We’ll discuss that a little later.)
Join 2,000+ traders
For less than $0.80/day, unlock a proven swing trading strategy, real-time trade alerts, and access to a private Discord community.
Let’s move on to another example.
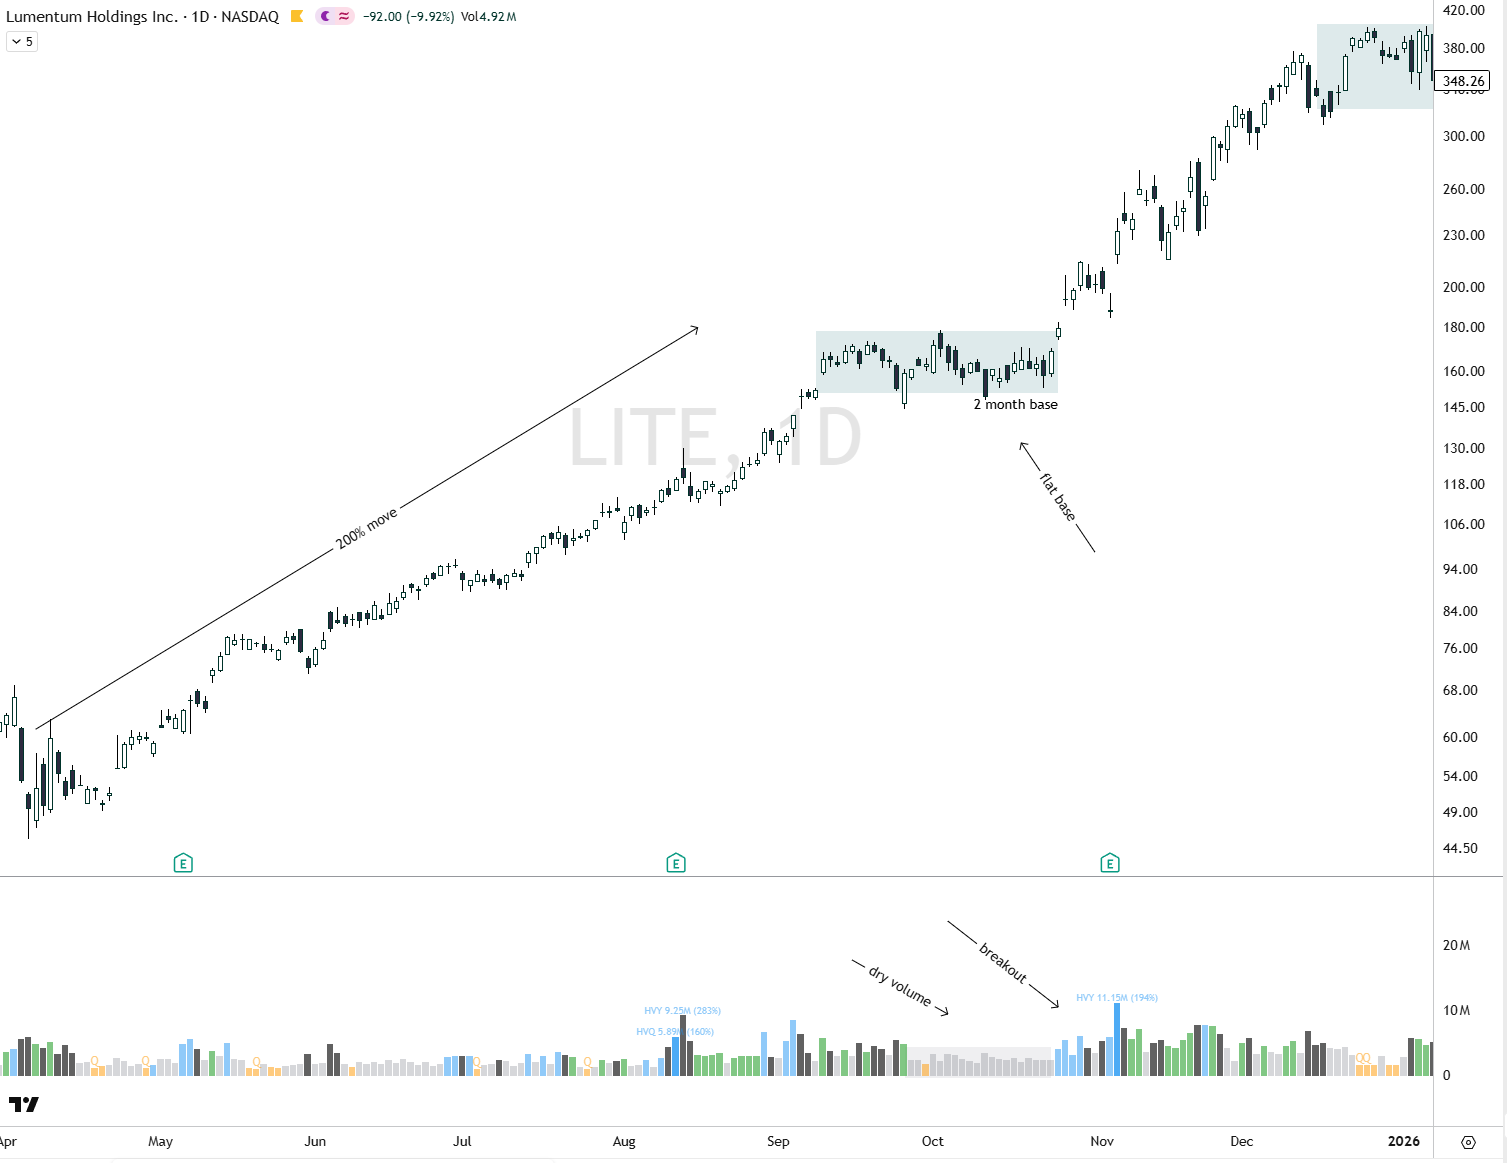
LITE (on the daily timeframe), notice how, after a 200% move, LITE forms a base with absolutely no volume, and then breaks out two months later with increased volume.
Notice how it breaks out even before earnings, leading to another 160% move, at which point it forms another consolidation period of about two months, after which it moves another 200%.
Another trade I took was DELL.
This one is a bit different because it doesn’t follow all the rules and is a combination of a flat base breakout and an EP setup, but I want to show it to you because real-world examples aren’t always perfect.
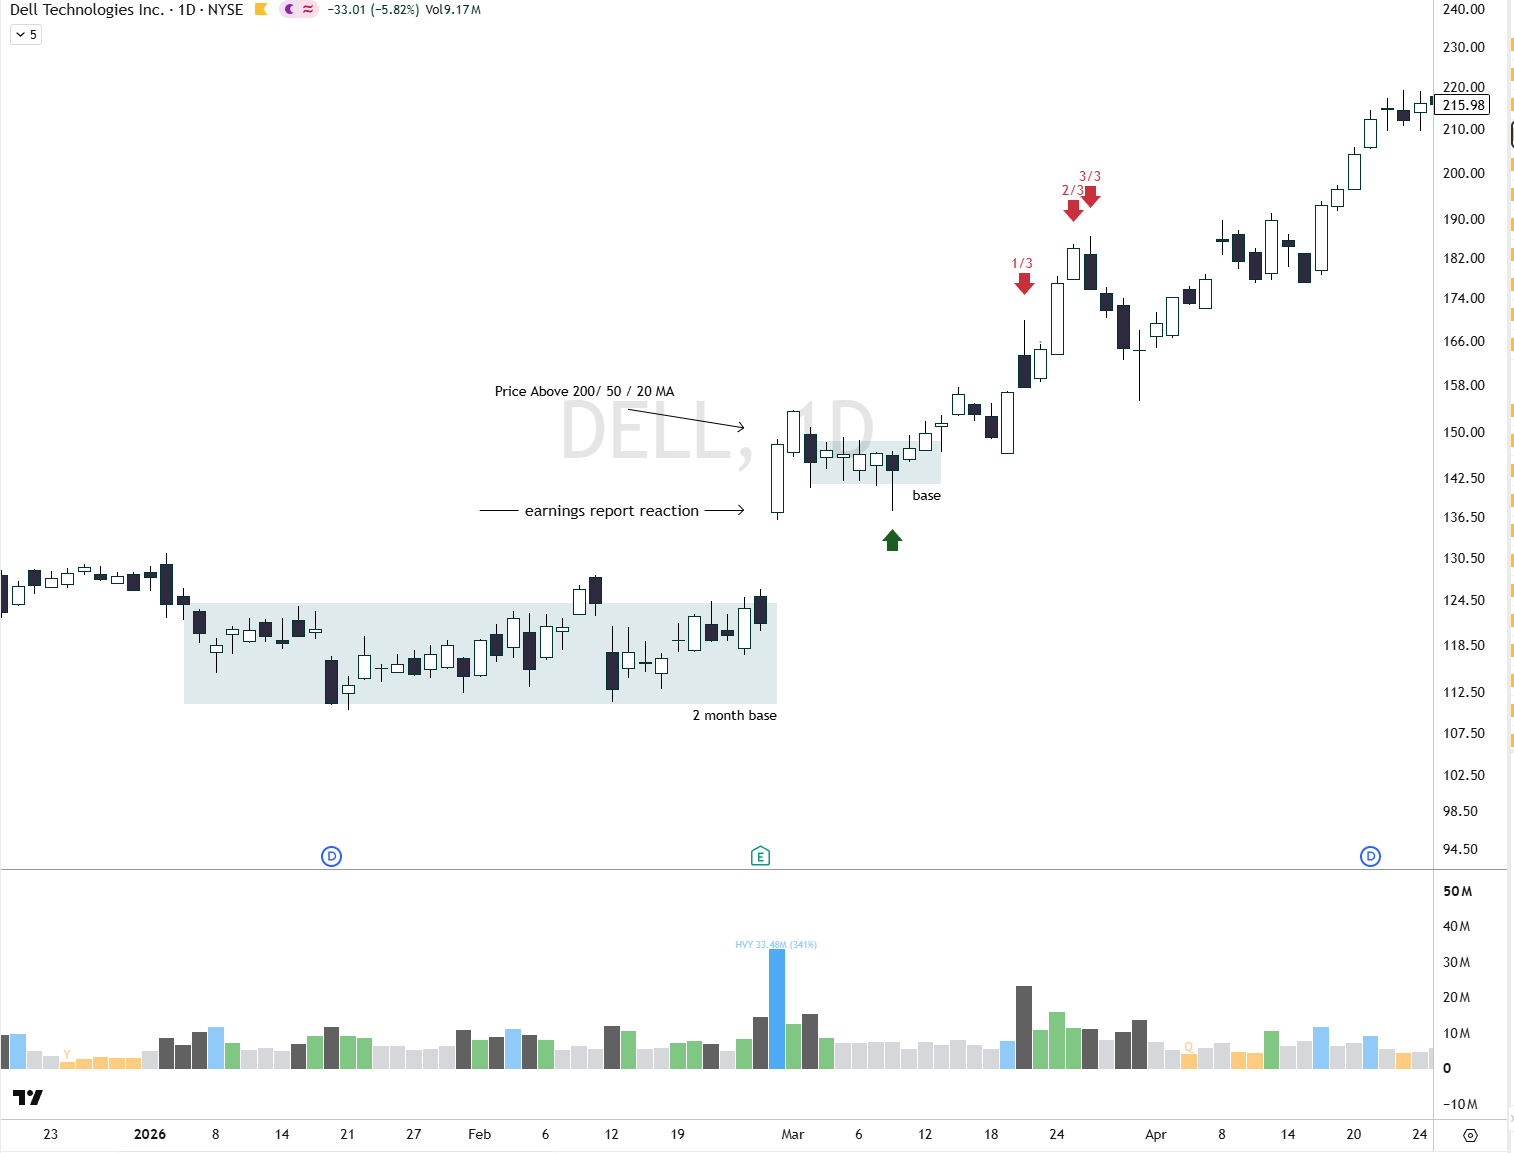
The price breaks out of the two-month base with increased volume and then consolidates for the next 10 days, at which point I buy that undercut.
And I ride it for about a 30% gain.
And if we look further back at what happened, we find exactly the same pattern forming right now, as we speak.
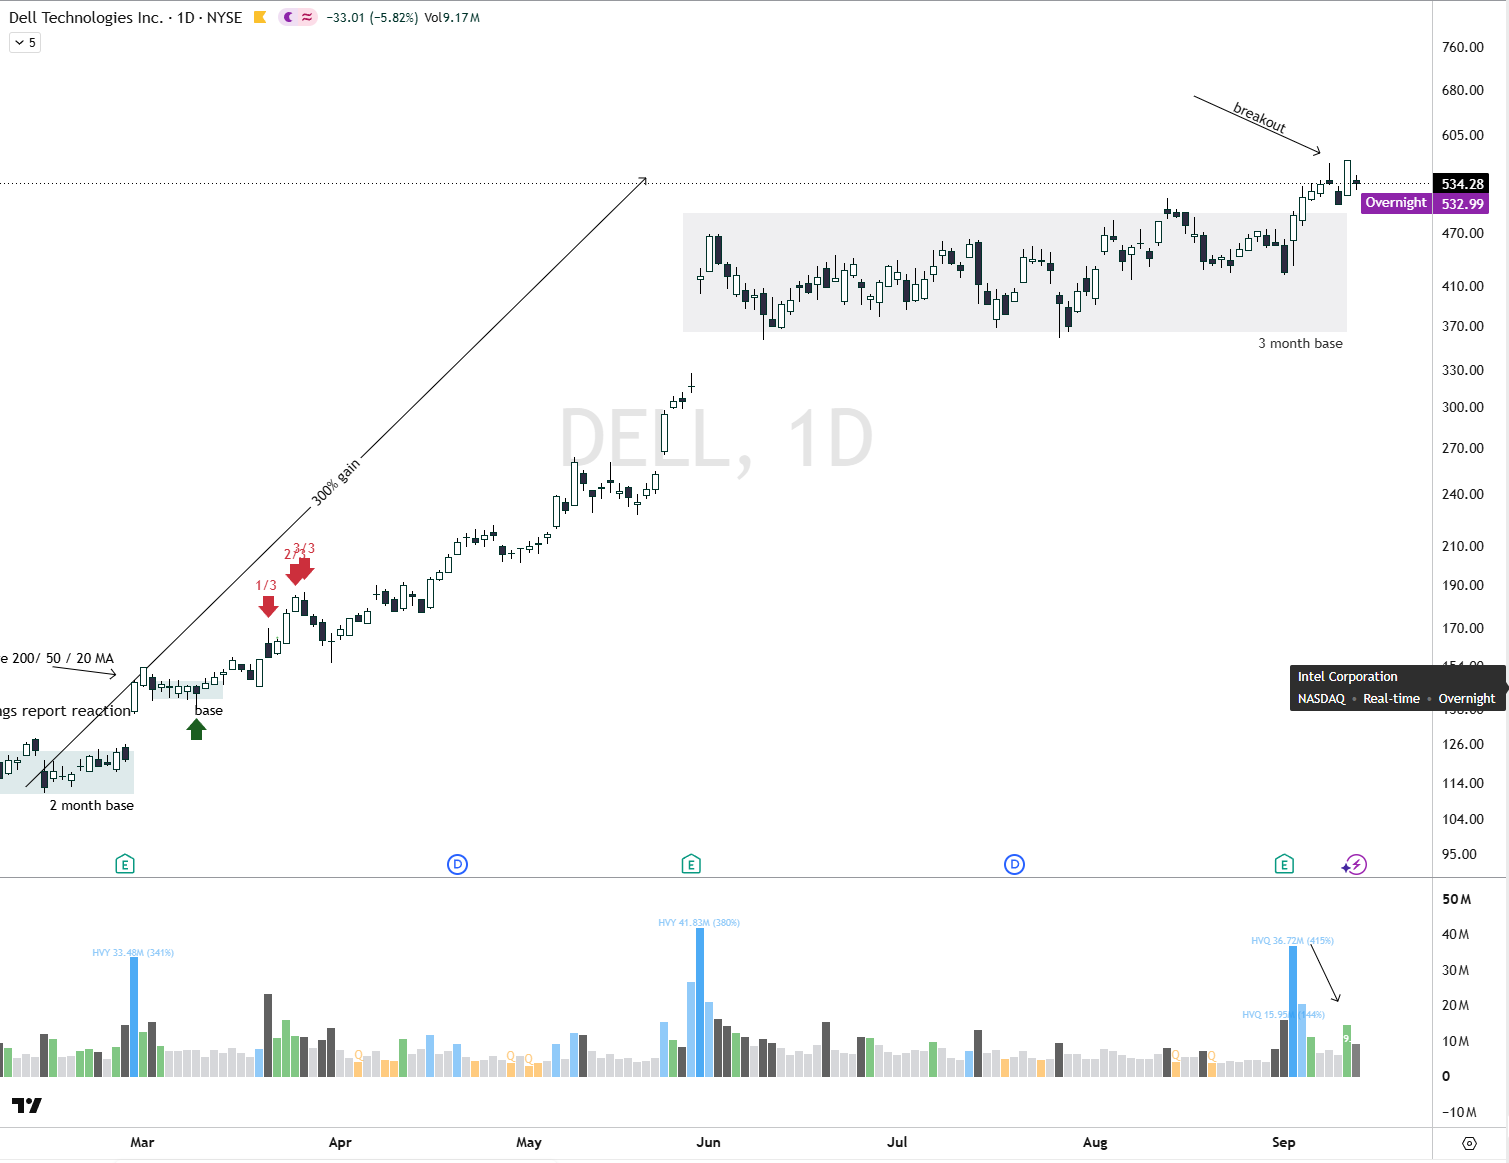
And these patterns form over and over again on tens of hundreds of stocks. (Some examples that come to mind right now for you to check out are NVDA, BE, PL, MU, SNDK, and AMD.)
Of course, not everything is perfect, there are also
Failed Base Breakouts
Here’s an example that had all the ingredients
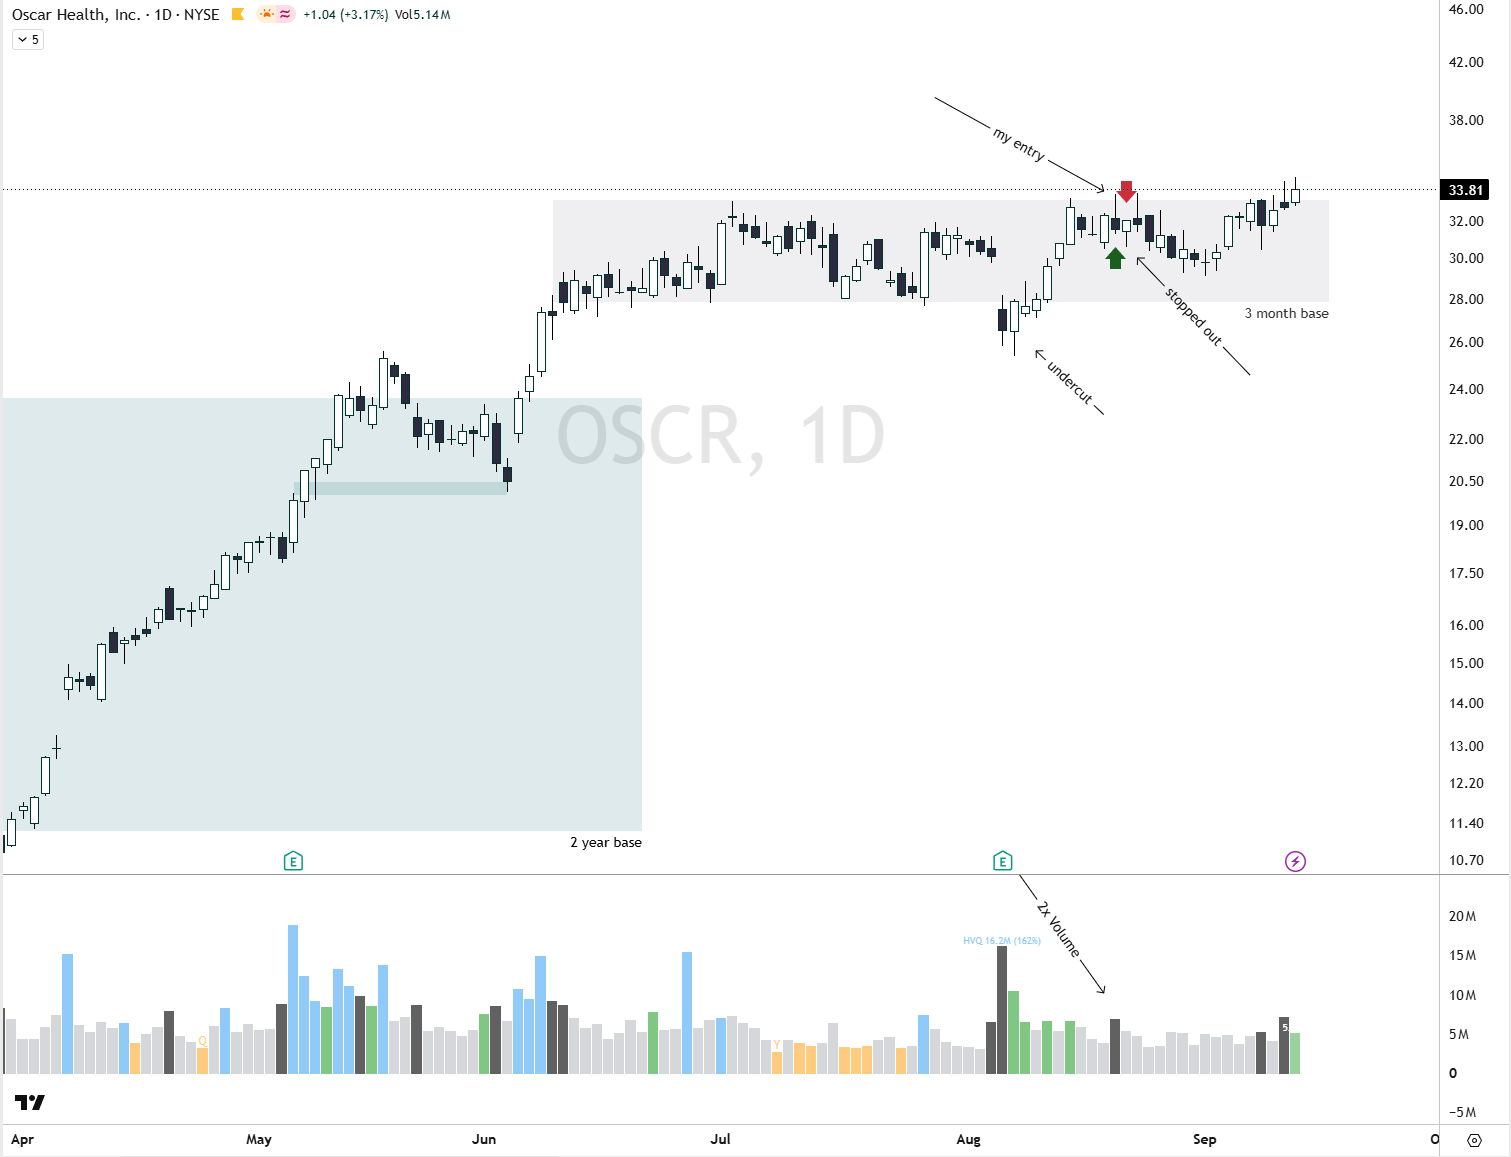
Notice how the OSCR (daily timeframe), at the time of my entry, had a 2-month base; in fact, on the day I entered, it had 2x Rvol. So the volume confirmed the entry only to trigger my stop loss the next day.
It gapped down the next day, then reversed, and then started to chop.
One thing was missing here, and that’s why I got stopped out.
And that was: THE GENERAL MARKET.
If you look at August 20, 2026, the SPY fell by 0.84%, and overall, the price action was terrible for the vast majority of stocks.
So the lesson here is that if you don’t have the general market on your side, the likelihood that a breakout will work is low.
Even the legendary William O’Neil says:
“three out of four stocks usually follow the overall market trend, whether it’s up or down. That’s why it’s critical for you to learn to follow, not fight, the market.”
I want to be honest with you and tell you that in real-life trading, there is no such thing as a perfect flat base breakout setup. And many of them will feel uncomfortable.
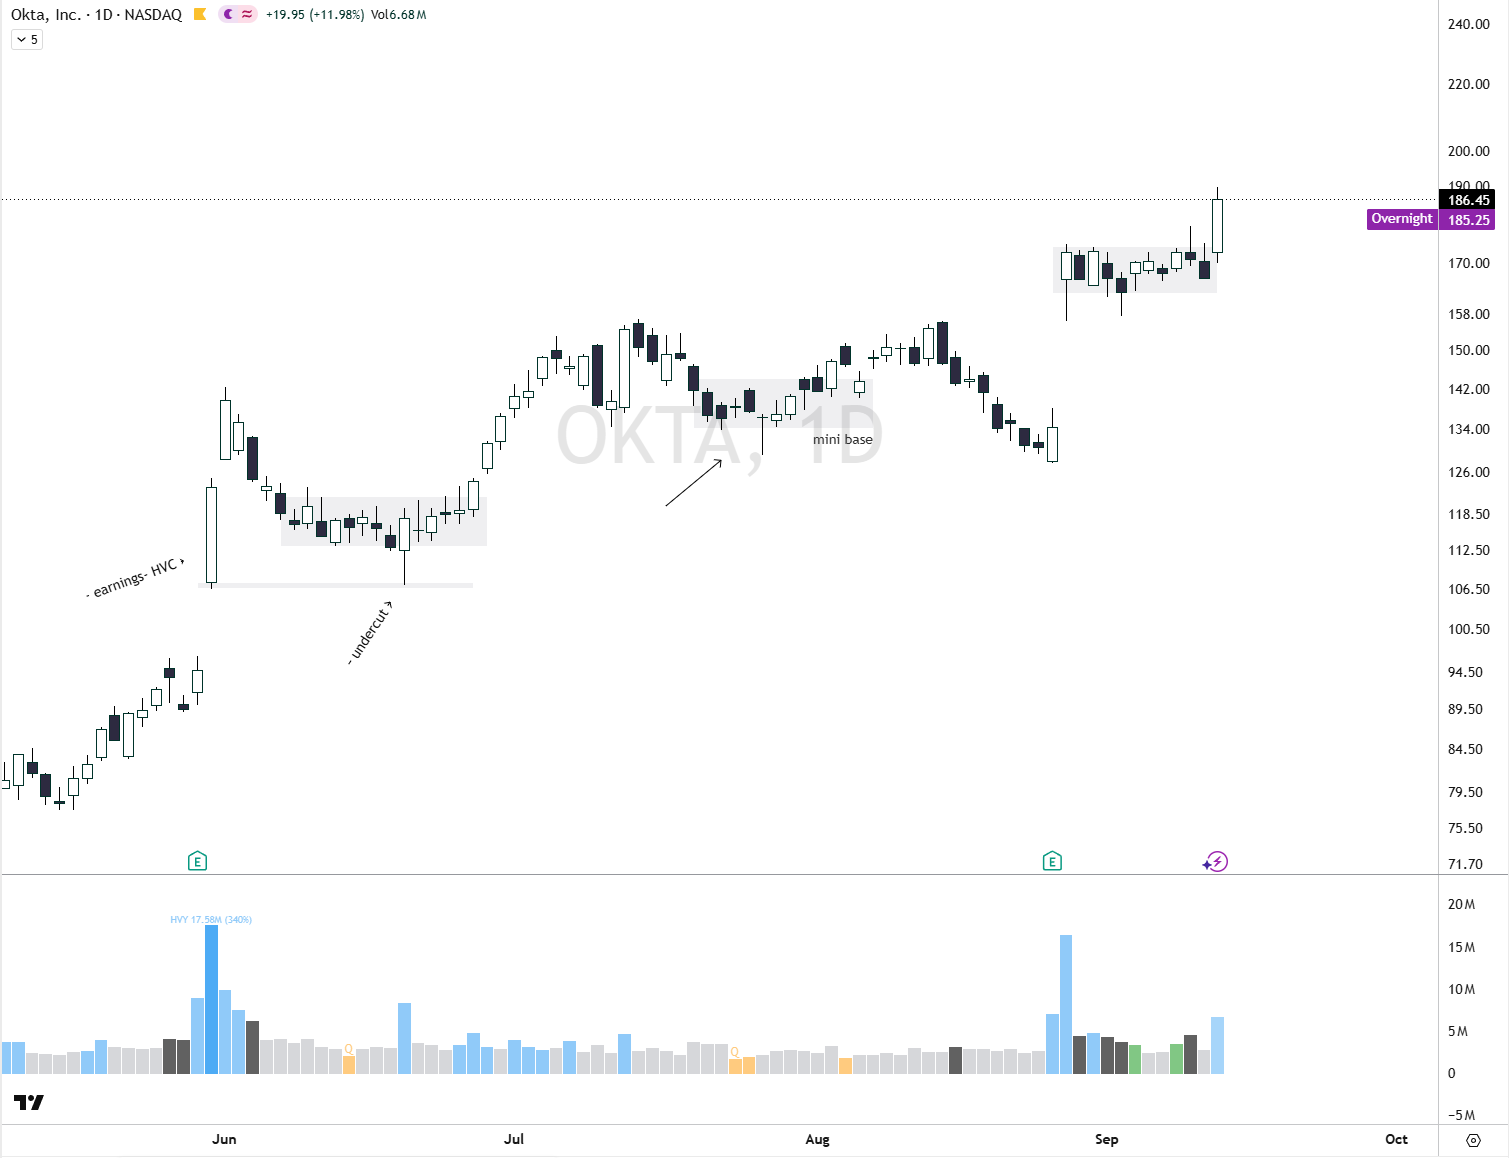
Here’s an example
Notice how, on the chart below (OKTA, daily timeframe), if rule number 2 (the duration of a base) isn’t followed, the price movements are much less significant.
However, if you’re trading on a shorter timeframe, you can take advantage of these “mini bases.”.
How can you improve your ability to identify a flat base breakout setup?
Simple.
Study hundreds of charts.
Take every winning stock from the current and previous years (those with gains of at least 100%) and mark their support levels and the moment they broke out on each chart.
Actually simulate on the charts where you would have entered and where you would have exited.
Also mark the failed breakouts. Why did they fail? What was missing? What were the general indexes doing at the moment that particular stock was attempting to break out?
Another helpful thing is to learn what stage that stock is in. (An idea popularized by Stan Weinstein)
Common Mistakes Traders Make When Trading Flat-Base Breakouts
The most common mistake, one I’m guilty of as well, is:
- Entering too soon.
Often, you’ll be eager to get into a stock, but the market won’t serve up these trades on a silver platter. You have to be patient and allow at least 4 weeks for that base to form.
Over time, you’ll notice that the fastest upward moves are the least sustainable; they’re erratic movements that trigger stop-outs for both longs and shorts.
-- Not taking into account what the group that stock belongs to is doing.
As we know, stocks move in groups; if that group lacks a catalyst, it will be hard for the stock to move. If you’ve chosen a laggard instead of a leader, you’ll either get chopped up or end up with a lower return that will eat into your edge.
--Traders ignore volume.
You want to see at least 1.5x Rvol when the breakout occurs. The vast majority of breakouts that fail are those that don’t have a surge in volume.
How I Increase the probability of a successful flat base breakout
Increase the probability of this trade
Combine it with the fundamentals.
You want to see accelerated growth in sales. (Sales are the heart of a business.)
If you look at the examples above, they all had one thing in common: they had accelerated growth in sales.
Many companies break out on high volume after earnings. Because when the market, analysts, and institutions realize that sales growth has accelerated, they need to reprice their models and start their “buying” program.
Also, as I mentioned above,
Check how the market is performing.
If the general market isn’t performing well, 90% of breakouts will fail.
Keep the market in mind.
There are several tactics for knowing when to be aggressive and when to be defensive. But one of them (the simplest) is to check if the SPY price is above the 10- and 20-day moving averages.
Flat base breakouts are easy to understand in theory. The real work is finding them early, filtering out weaker candidates, understanding the broader market, and managing the position once you are in.
That is why I built the Freedom Trades PRO Membership.
Every week, I share high-probability stock ideas, top-ranked scanner setups, market context, and the exact swing-trading framework I use to make decisions. When I enter or exit a trade, PRO members receive real-time alerts and can follow the reasoning behind the move.
You also get access to our private Discord community.
If you want to spend less time guessing and more time following a repeatable process, PRO gives you the framework to do it.
Trade Setups of The Week
High Probability Trades for 14-18 September 2026

Inside this issue, you’ll find 7 high-probability trades with their charts, and next to each ticker, you’ll find the exact type of setup I’m watching.
If you think this newsletter could help your friends, share it with them so it can reach as many traders as possible.
And here’s the fun part: when you share it, you can unlock special rewards + you will look smart in front of your friends :)
“One trade closer to freedom.”
Vladislav