

Today I’m going to show you how I scan the entire market and how I find opportunities like HPE, RKLB, WULF, and SNDK before they take off.

And it’s all thanks to the idea generator = that is, a scanner.
This scanner essentially scans the entire market and provides me with trading ideas based on the filters I select.
I have a total of 5 scanners, and today I’m going to share 4 of them with you.
(*We use the 5th one in the PRO community.)
And I’m not just going to share the links, I’m also going to teach you how to use them and what to look for.
All the links are to Finviz, and you don’t need a premium account to access them…they’re completely free.
Before I give you the links, I want you to understand how I come up with trading ideas.
How I Come Up with Trading Ideas - A Top-Down Approach
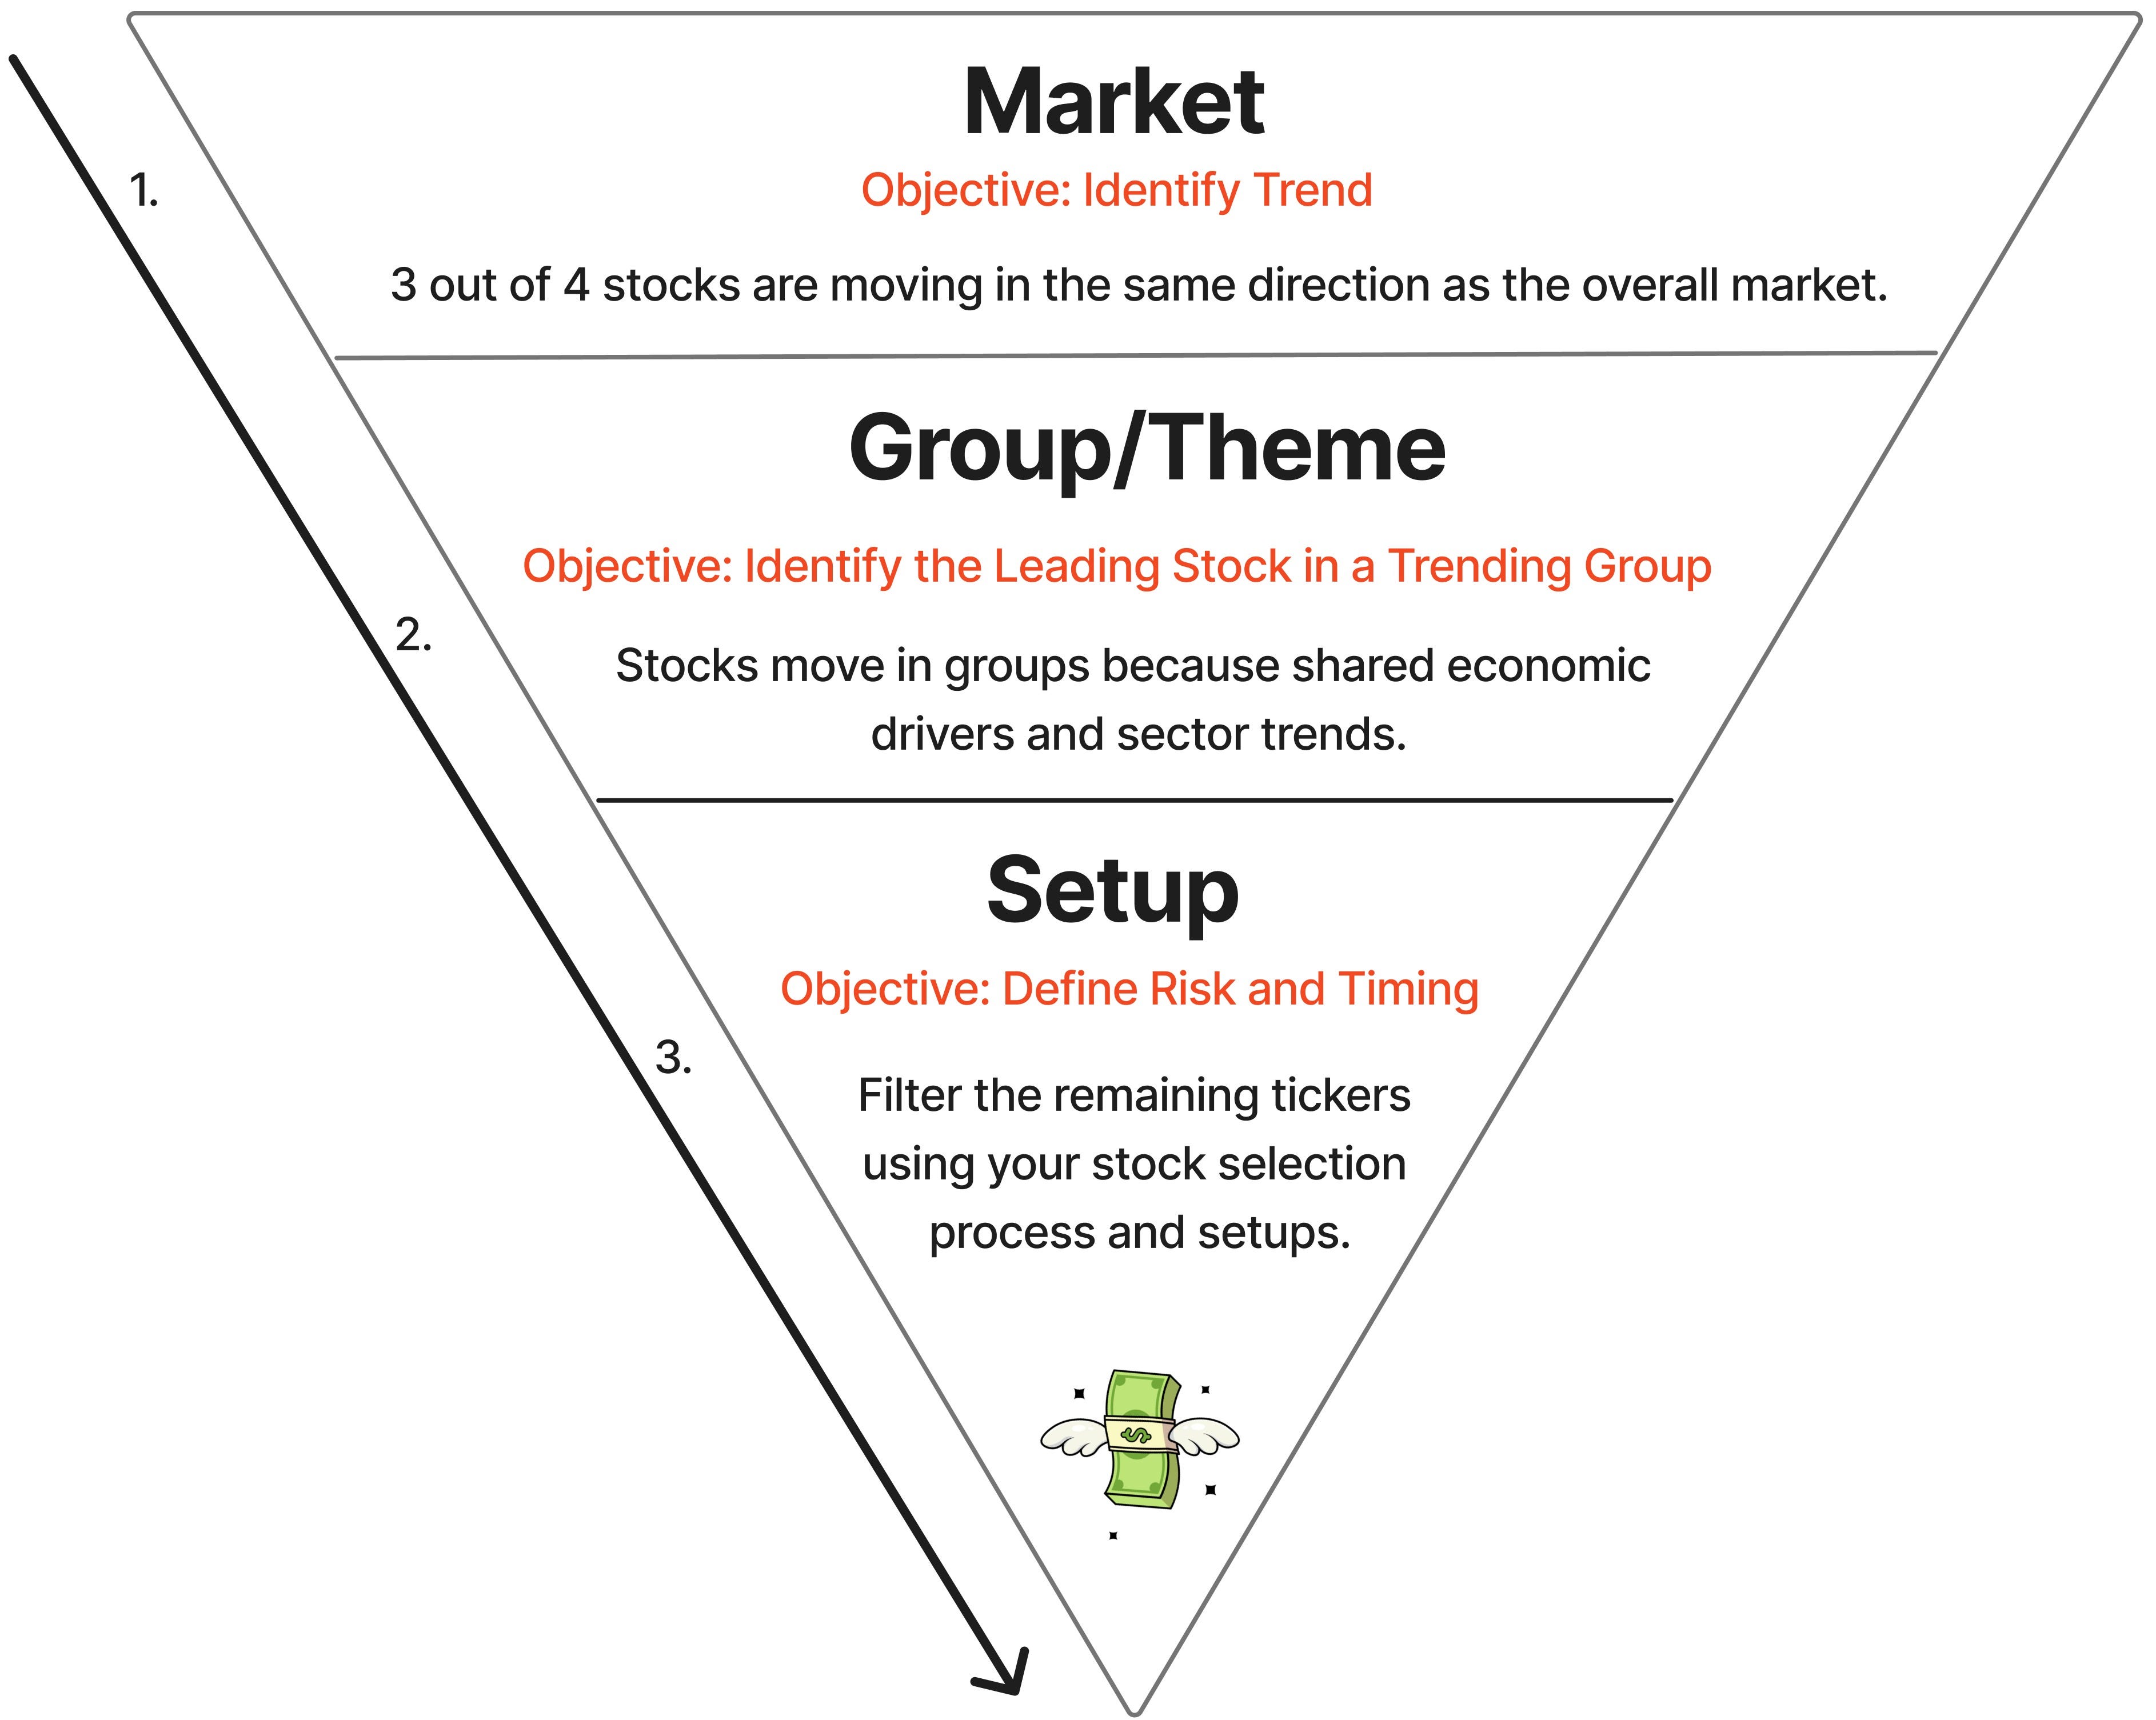
A good trading idea doesn’t start with a setup.
It starts with the market.
The first thing I analyze is: how are the major indexes performing?
Is the market in an uptrend?
Is it in a downtrend?
Is it choppy, with no clear direction?
This step is essential.
William O’Neil studied market behavior from 1900 to the present.
One of his conclusions was:
3 out of 4 stocks are moving in the same direction as the overall market.
That’s why you always need to pay attention to the overall context.
You might have the best setup on a chart. But if the market comes under heavy selling pressure, your odds drop significantly.
A simple way to gauge market strength for long side: If the 10-day MA is above the 20-day MA and the VIX is below 20, you can go push.
If the 10-day MA is below the 20-day MA and the VIX is above 20, reduce your position size and consider staying in cash.
Identify the strong group
Once you understand how the market works, the next step is to identify the groups that are showing strength.
Most emerging themes move in groups.
For example, if NVDA starts to move, it’s very likely that AMD or MU will join the move as well.
Stocks in the same industry tend to move “in a pack.”
Your job is to identify the group’s leader.
Why?
Because, historically, leaders tend to deliver higher returns than laggards.
At the same time, when the group starts to weaken, leaders tend to hold up better. Laggards usually fall more sharply.
A simple way to track sectors is to have a separate watchlist with the following ETFs:
XLK – Technology
XLY – Consumer Discretionary
MAGS – Magnificent 7
XLC – Communication Services
XLI – Industrials
XLRE – Real Estate
XLU – Utilities
XLB – Materials
XLF – Financials
XLP – Consumer Staples
XLE – Energy
XLV – Health Care
Basically, here you have all the important sectors, plus the Mag 7.
Analyze them one by one.
Look for sectors that are trending upward. Look for those that have relative strength compared to the market.
Only then do you move on to the next step.
Individual Stocks: Finding Setups
I’ve shared all the setups I use here:

Many traders believe that the setup is the most important thing.
In reality, it is the least important of the three elements:
General market
Group or sector
Individual setup
What increases your probability of a successful trade the most is the context.
What is the market doing?
What is the sector doing?
Is your stock a leader or a laggard?
The setup isn’t a magic formula. It isn’t the only reason a trade works.
Its main objective here is to define your risk.
It helps you avoid random trades made without a clear plan.
For example:
In an undercut and rally setup, the stop-loss can be placed below the key level where the undercut occurred.
In an earnings gap (EP), the stop-loss can be placed below the low of the day (LOD).
In a flat base breakout setup, the risk can be defined below the pivot or below the relevant support level.
The setup gives you a clear point of invalidation.
That’s its real value.
You don’t enter a trade just because it “looks good.” You enter because you have a favorable context, a leader from a strong group, and a clear level at which your trade is invalidated.
Search for relative strength
Another extremely important factor is relative strength.
You want to find stocks that outperform the market and outperform the rest of their sector.
During good times, these tend to be the first to break out.
During difficult times, these tend to hold up better.
What scanners do I use?
1. CANSLIM , a scanner that provides stocks fitting William O’Neil’s strategy.
Link to the scanner: Link
Developed by the legendary William J. O’Neil, CANSLIM is the ideal formula for identifying top-performing stocks.
This filter helps us identify market leaders, companies with excellent fundamentals and momentum, poised for a potential breakout.
The filters are designed to highlight stocks that meet the golden rules:
Market Capitalization & Liquidity: Market Cap > $2B
Average Volume > 2M.
We avoid illiquid companies and focus on those where we can enter and exit cleanly.
Aggressive Growth: Sales Growth Q/Q and TTM > 25%.
We look for companies that are generating massive revenue right now.Institutional Transactions > 0.
This confirms that funds and banks are accumulating the stock (a vital criterion in CANSLIM).
Price near the highs of the last 20 and 50 days.
True leaders hit new highs, we’re not looking for stocks on sale.
Use this scanner to create your weakly watchlist.
Look for clear consolidation patterns on the chart (Cup and Handle, Flat Base).
Buy Point: Enter when the price breaks through resistance on high volume.
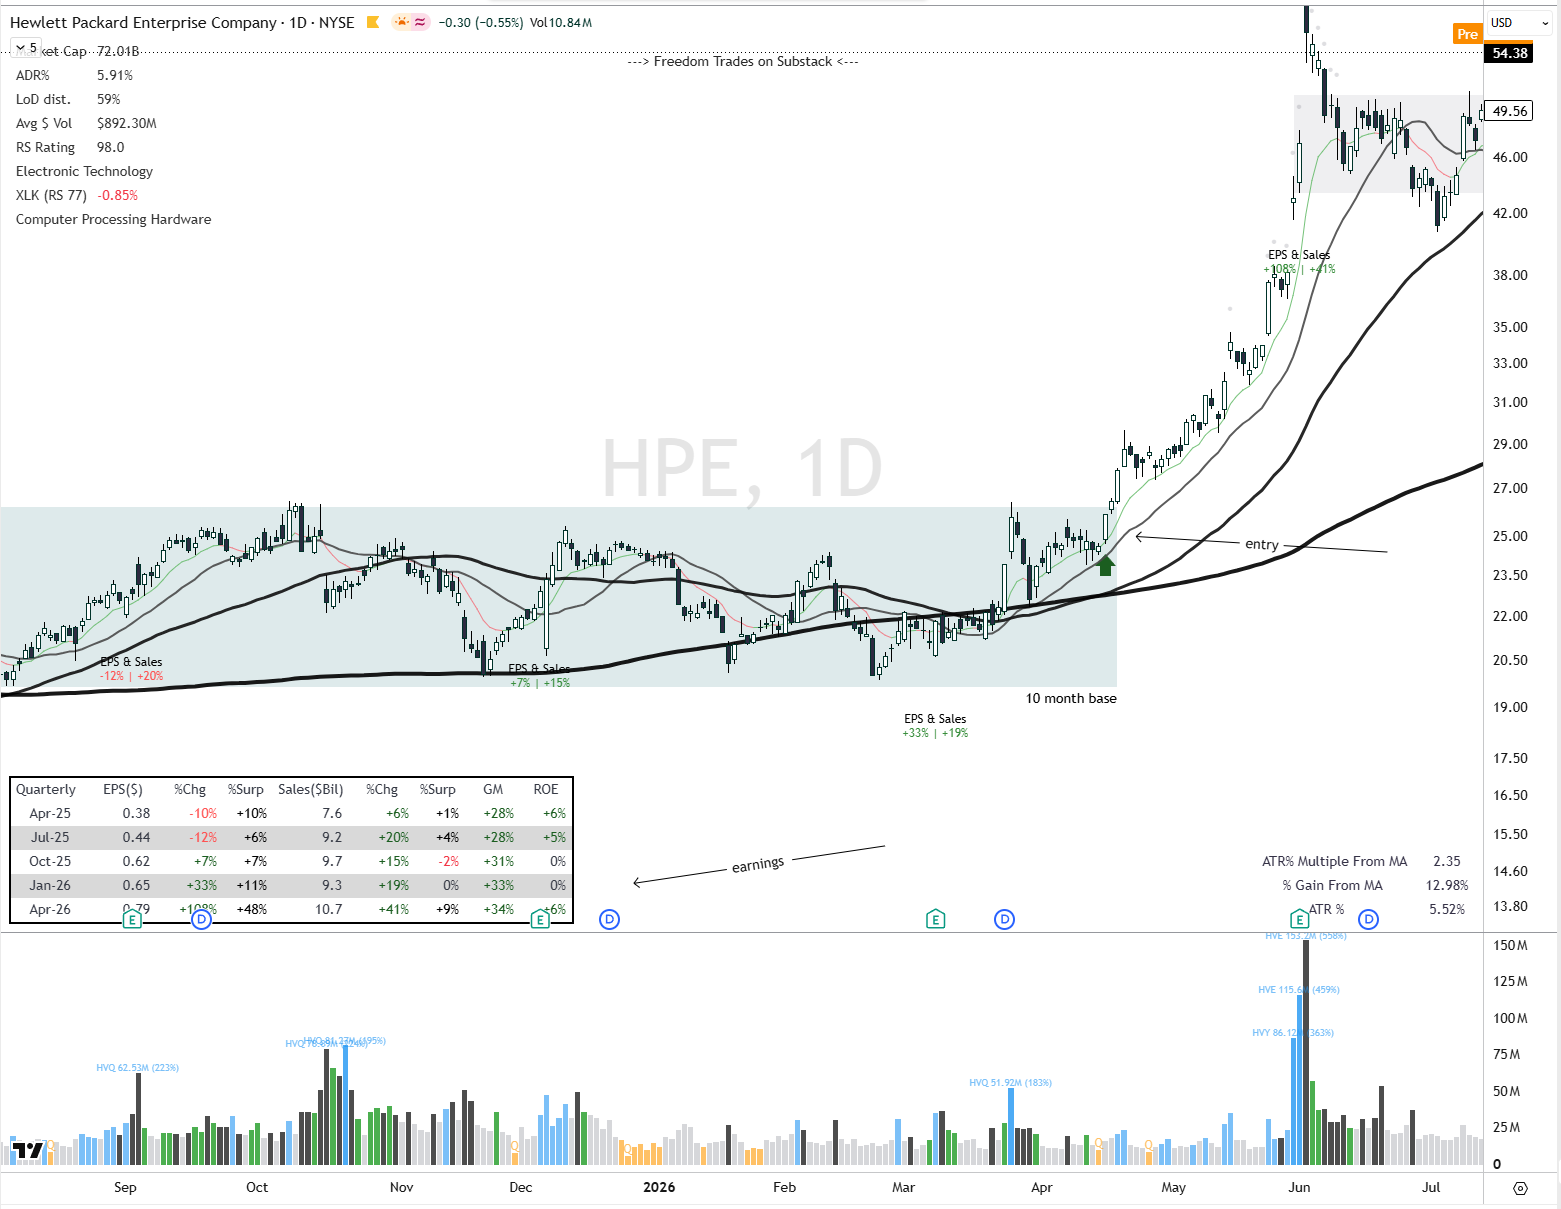
Here’s an example of a trade I took using this scanner.
HPE appeared in this scanner in April before it skyrocketed.
2. A scanner that finds the hottest stocks, I check this daily.
You can access it here: Link
Focused on identifying the “hottest” stocks, ideal for aggressive momentum trading and potential short squeezes.
This scanner identifies stocks with explosive performance, a small float, and huge market interest.
Here are the filters:
Small Float: Float < 500M.
There are few shares available for trading.
When demand increases, the price easily skyrockets due to limited supply.
Explosive Momentum: Performance: Quarter +30%.
The stock has already risen massively in the last quarter, confirming its status as a short-term market leader.
Short Squeeze Potential: Short Float > 20%.
Many traders are betting against the stock. If the price continues to rise, they will be forced to buy to cover their positions, fueling an even more dramatic price surge.
Volume and Liquidity: Average Volume > 2M and Current Volume > 1M.
There is sufficient liquidity to ensure good order execution.
Institutional Accumulation: Institutional Transactions: Positive.
In addition to retail investors, “big money” is also supporting the rally.
Volatility: Volatility: Weekly – Over 5%.
We are looking for significant price movements, which are essential for swing trading.
How I Use It
Unlike CANSLIM, here we focus more on market psychology and supply-demand imbalances, targeting stocks prone to rapid price surges.
I check this watchlist daily.
Note that if no tickers appear, it means either you’re in the pre-market or there are no opportunities on that particular day.
Watch for Pullbacks: Look for technical patterns such as “bull flags” or tight consolidations after the initial +30% move.
Don’t buy the stock when it’s already overextended.
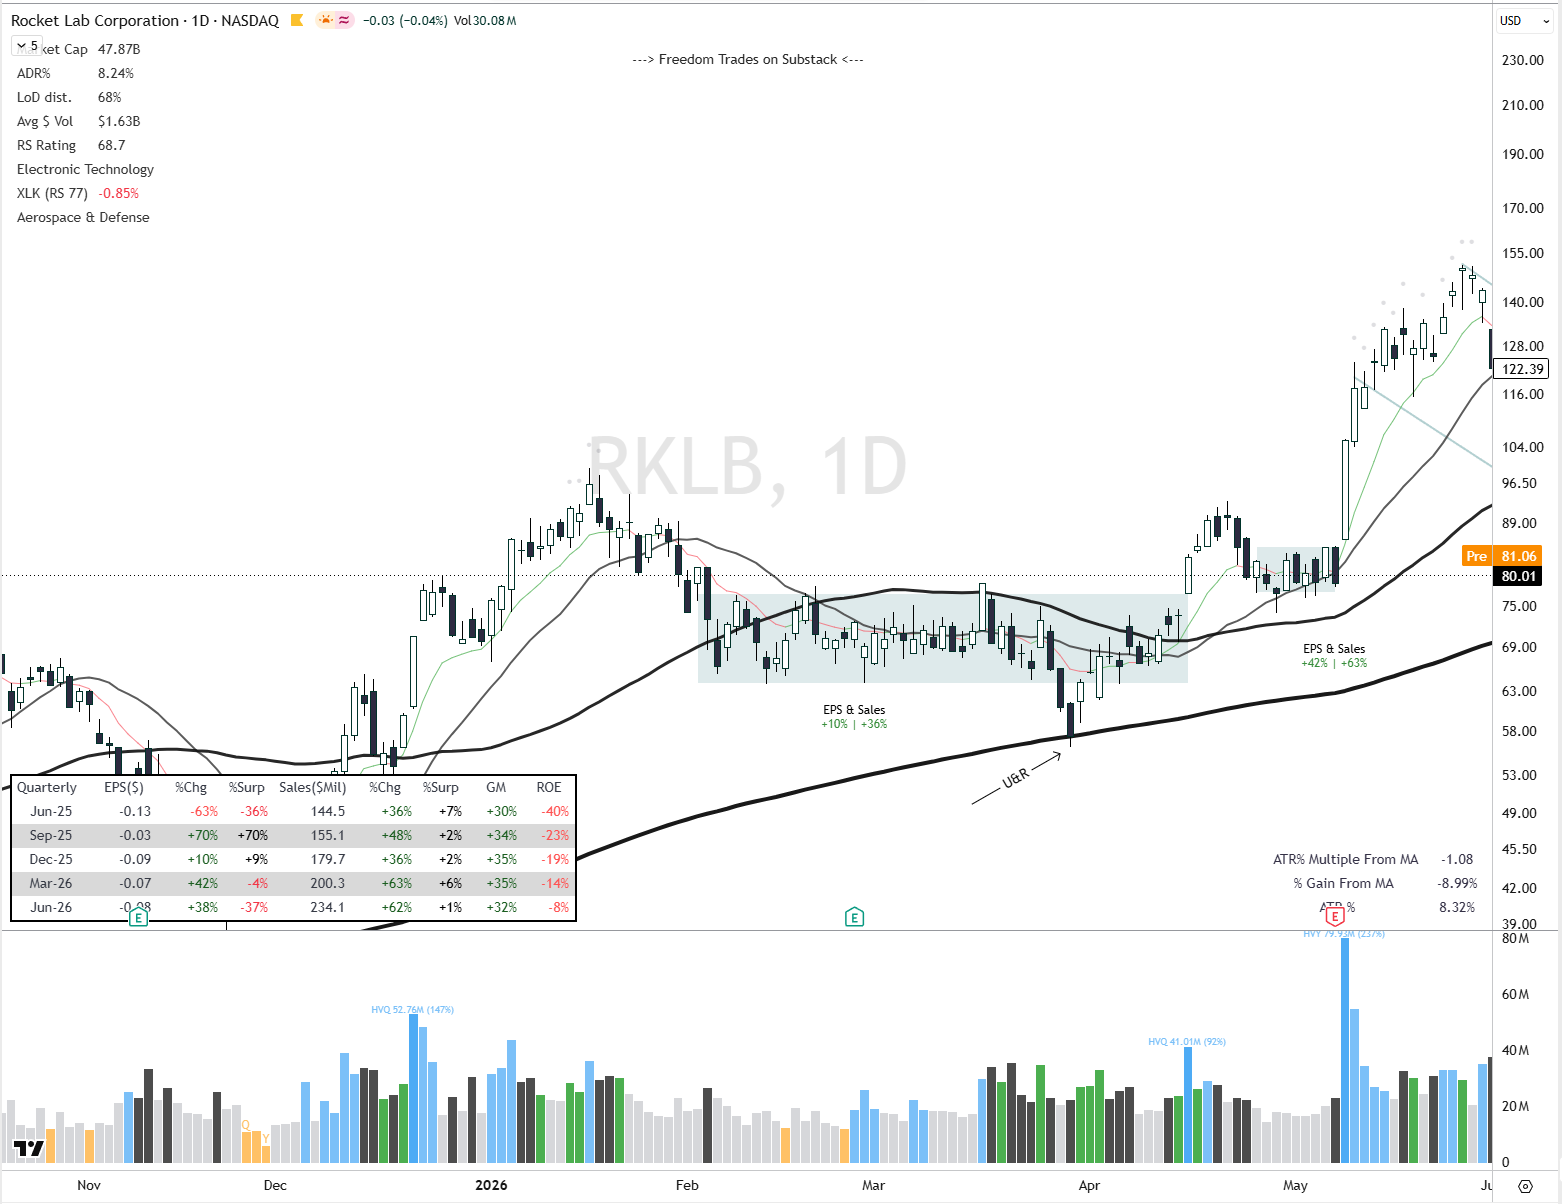
RKLB appeared in this scanner, where I captured a nearly 100% move using the “undercut and rally from the 50MA” technique.
3. A screener that identifies stocks forming bases at beaten-down levels.
Here is the link to the scanner: Link
This scanner, “Bases at Beaten-Down Levels,” looks for stocks that have been heavily sold off but are beginning to form a base.
The idea is simple: potential for a rebound.
What the scanner filters for
Small-cap: Market Cap > $300M.
It avoids micro-caps but remains in the riskier and more volatile segment.
Weak recent trend: YTD performance down.
It looks for stocks that have lagged behind and could be “reversed” by the market.
Well Below Highs: 200-Day SMA: price 20–20% below, and 52-Week High/Low: 30% or more below.
This indicates the stock is still “beaten down,” not already overextended.
Minimum Liquidity: Average Volume > 1M and Current Volume > 1M.
You want enough volume for the move to be tradable.
Good volatility: Weekly > 4%.
We’re looking for stocks that move enough for a swing trade.
Above $1: this filters out very cheap junk stocks.
Positive institutional interest: a sign that it’s not just a retail bounce.
How to Use It
This isn’t a scanner you should “buy blindly.” It’s for finding reversal candidates.
Look for a clear base: tight consolidation, stabilizing volume.
Check for the first signs of a rebound: higher highs, higher lows, volume at the breakout.
Enter only if the base begins to validate itself, not just because the stock seems cheap.
Keep your stop tight; with these stocks, the rebound can be quick, but so can the failure.
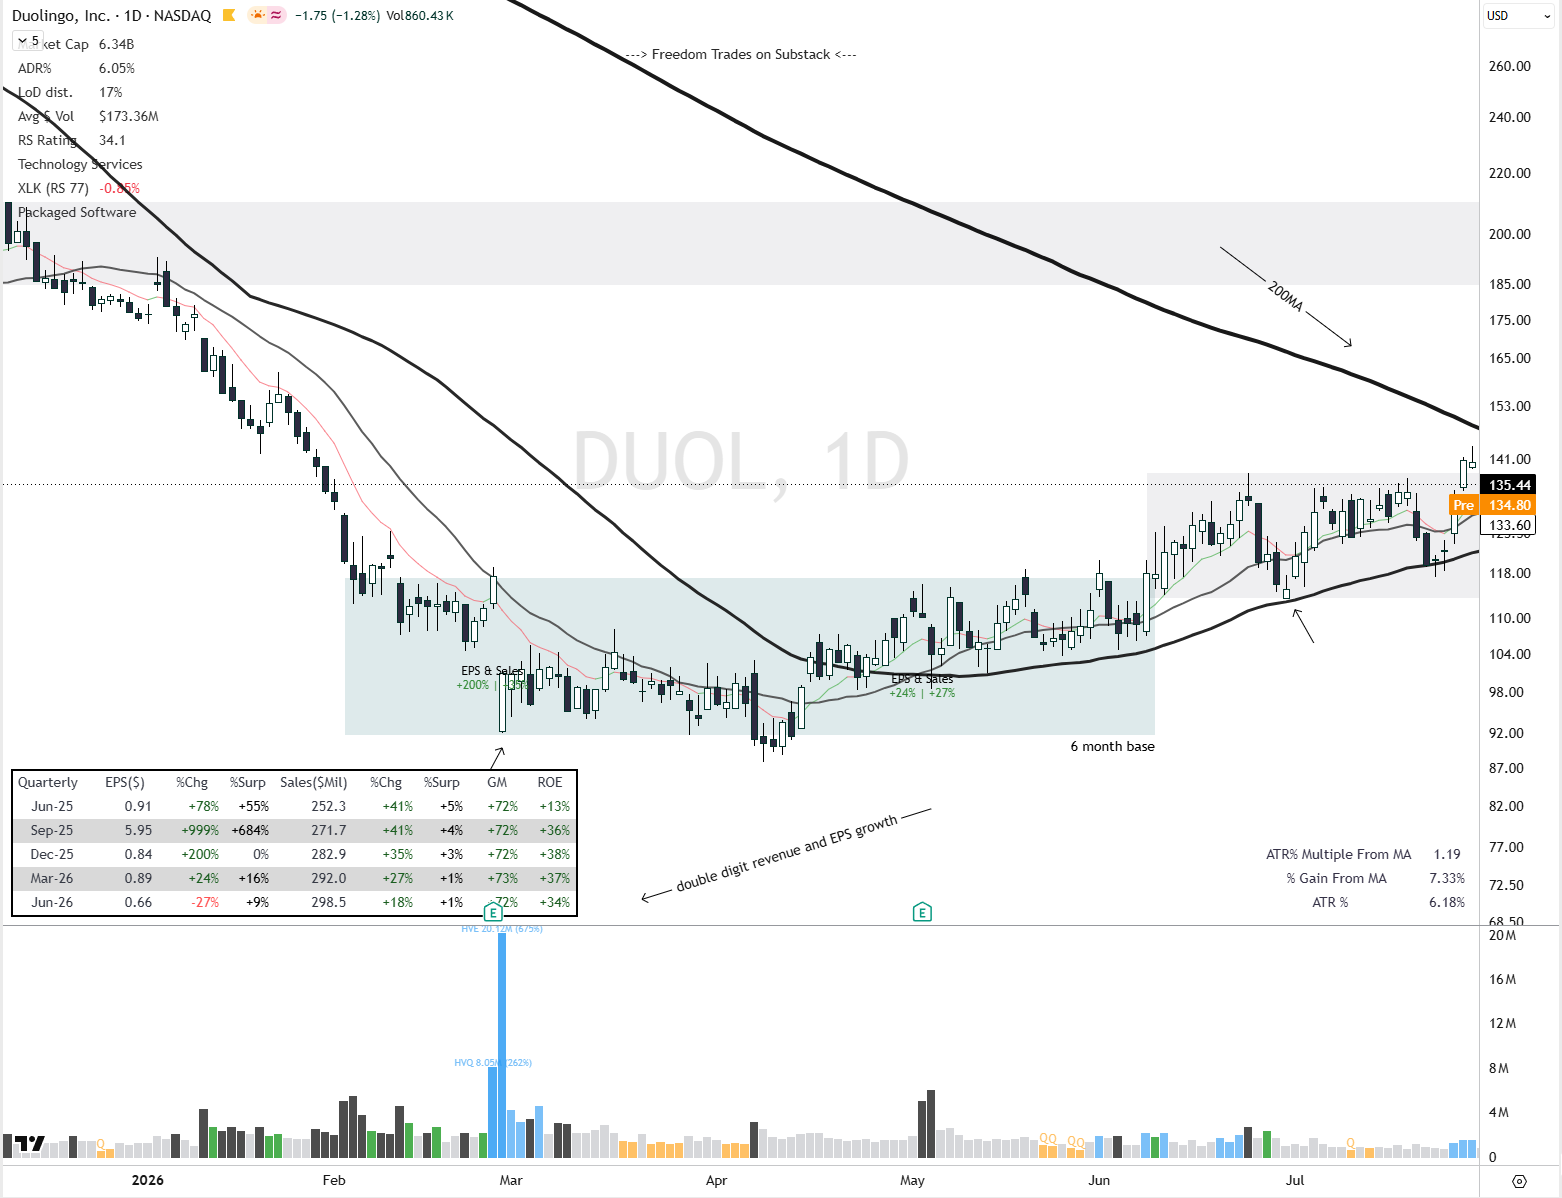
DUOL appeared in this scanner after the stock formed a 6-month base and moved toward the 200MA.
4. IPO screener.
Link to the scanner: Link
This weekly scanner looks for recent IPOs with a healthy profile: mid-cap, good liquidity, and institutional interest. All you need to do is check it once at the end of the week.
What the scanner looks for
Recent IPO: IPO Date: Within the last year.
We’re looking at new listings where price discovery is still underway.
Mid-cap: Mid-cap.
It avoids extremes and focuses on stocks that can generate significant trading volume.
Institutional buying: Institutional Transactions: Positive.
A sign that “big money” is coming in.
Good volume: Average Volume > 1M.
Without liquidity, the signal isn’t worth tracking.
How to use it
At the end of the week, note which stocks remain strong.
Look at the post-IPO structure on the chart: base, consolidation, breakout.
Add only the stocks that are holding up well and have volume to your watchlist.
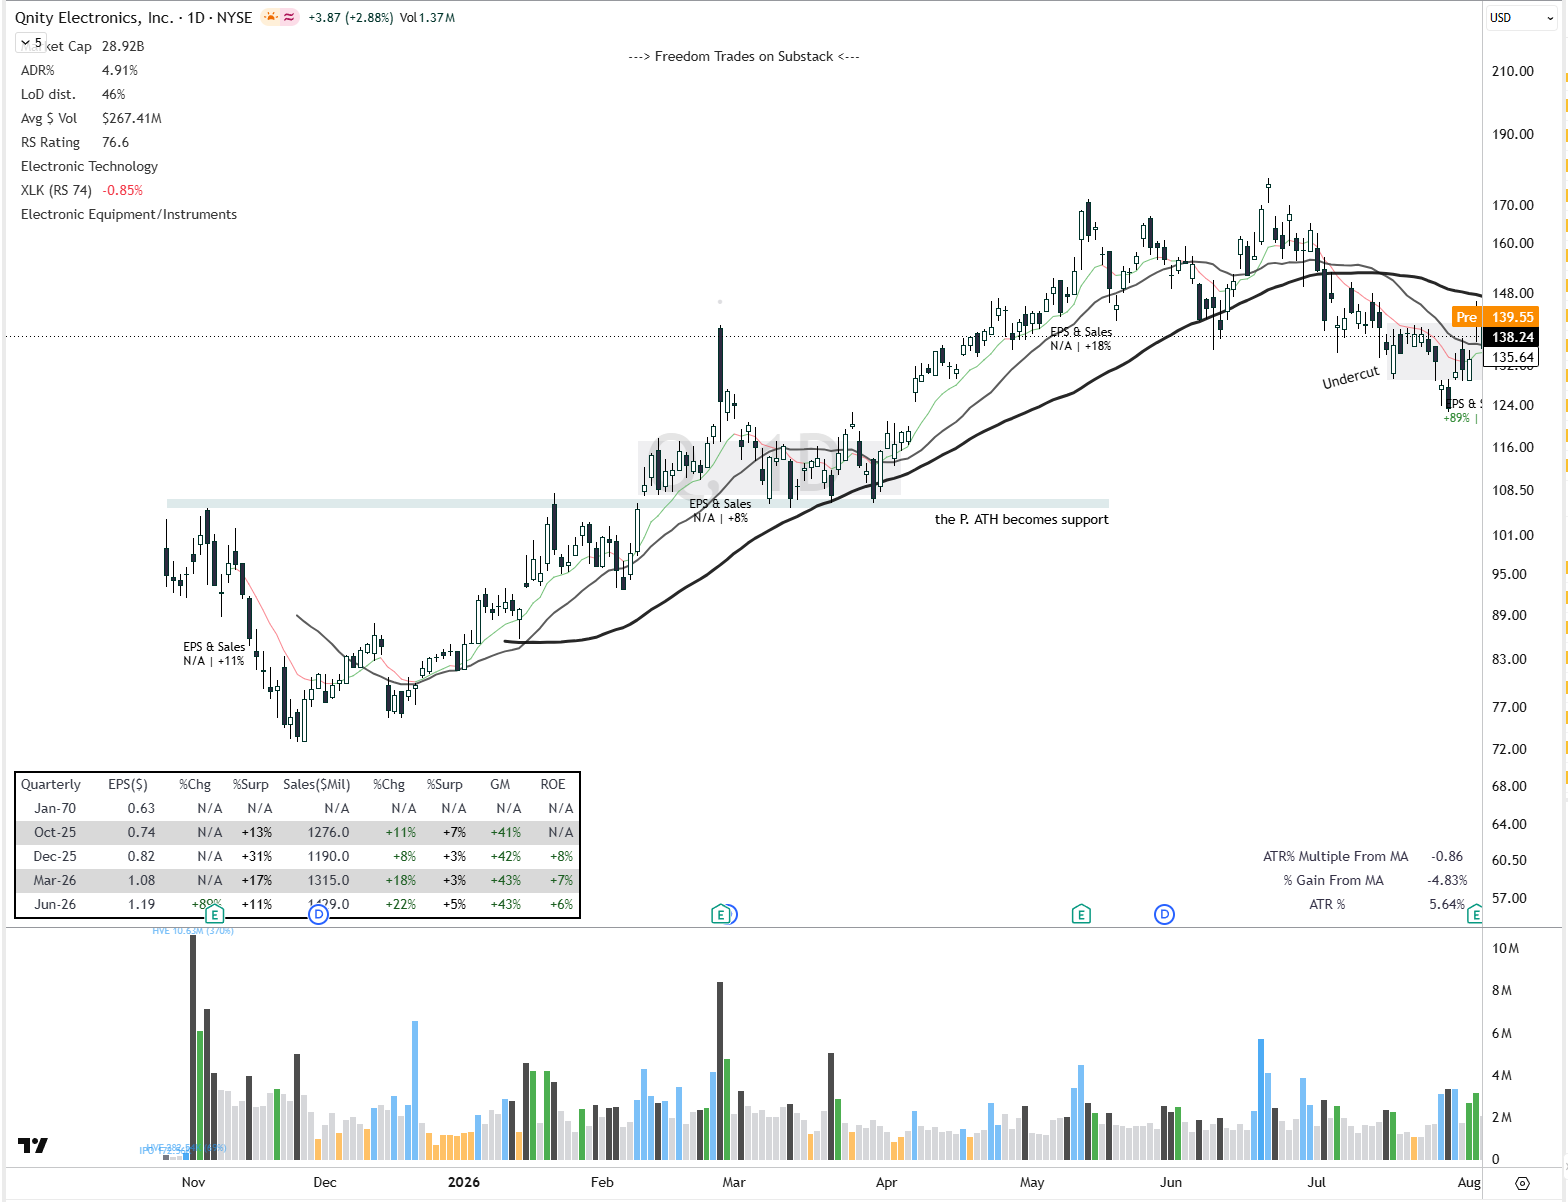
In this ticker, Q appeared after forming a cup-and-handle pattern and then creating a base where the previous all-time high became support.
Bonus: How to Scan for the Best Opportunities and Be Early for the Rotation
I have another tactic that I haven’t seen mentioned anywhere.
But it will give you a huge advantage.
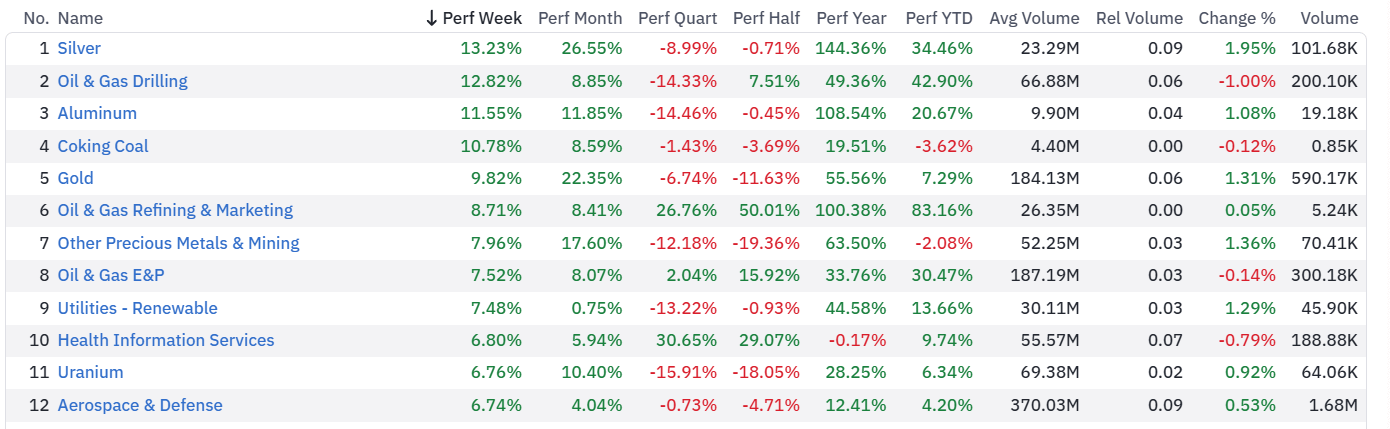
First, go here and check out the top 10 best-performing industries sorted by week.
At the time of writing this article, here’s what it looked like for me:
Now the next step is to use this scanner I created, and all you have to do is change the industry based on which one is the top-performing industry that week here:
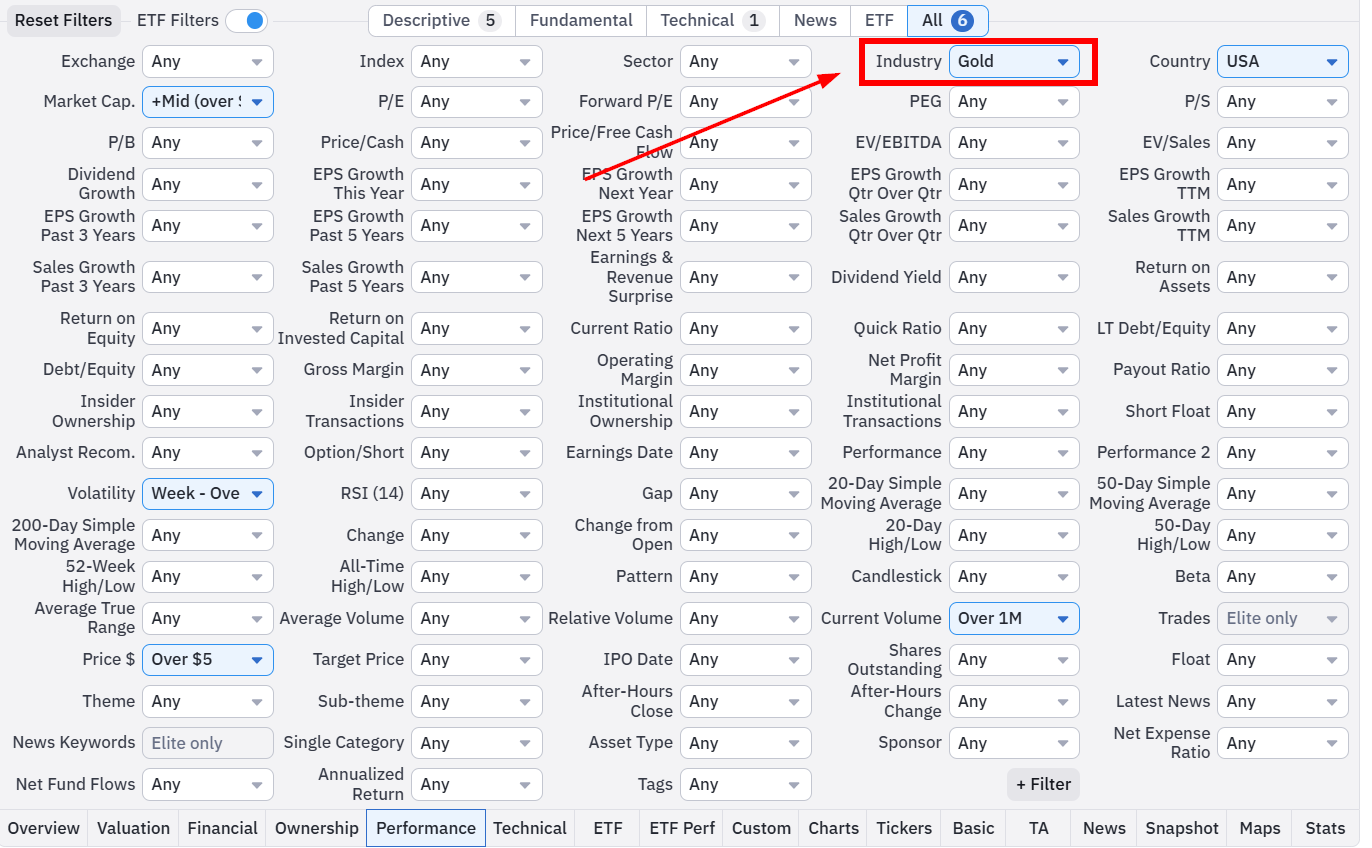
In other words, if “Silver” is in first place, you’ll select “Silver”; if it’s “semiconductors,” you’ll select “semiconductors,” and so on.
Then you take the tickers that appear there, add them to a watchlist, and start running them through the filters of the strategy we use in the Freedom Trades community.
Another thing to pay attention to here is “Relative Volume.”
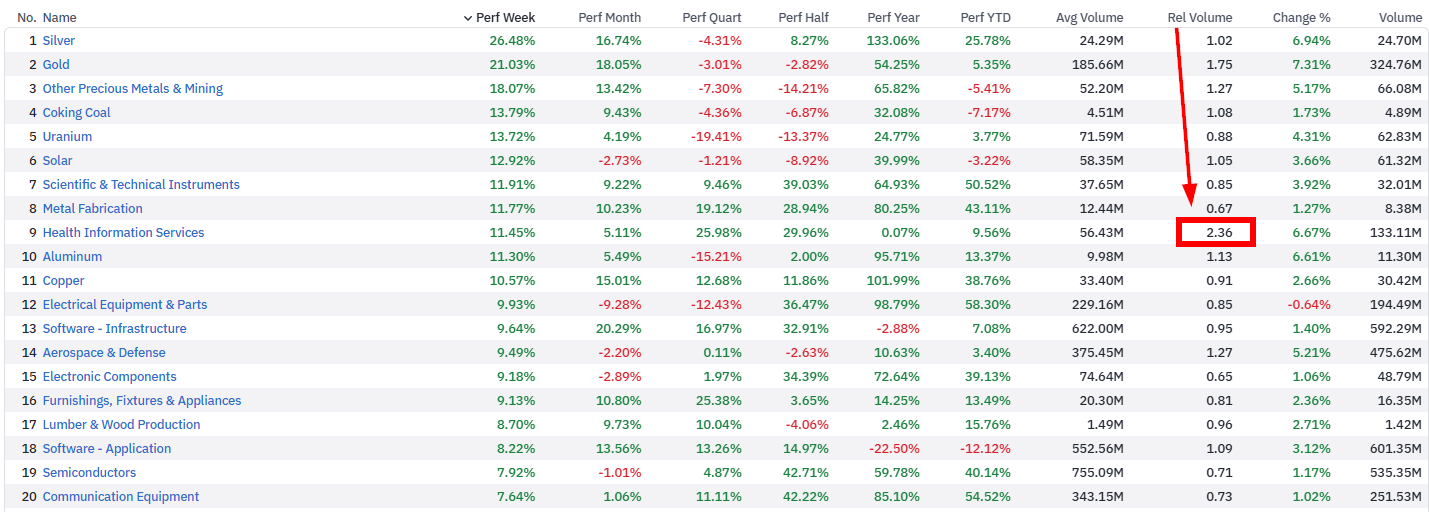
If you see that an industry has an RVOL above 2, as in the example above, it’s clear that a rotation is taking place in that sector at the time of the scan.
This is valuable information because often a capital rotation doesn’t last just a week, it can last for several quarters.
Make sure to switch industries as I mentioned earlier and check them before the market closes or after it has closed, not in pre-market trading.
If you have a job, or simply can’t devote a lot of time to it, which is the norm for the vast majority of us who do swing trading.
You don’t have to check all of them every day.
It’s enough to go through them once a week, over the weekend, add the relevant stocks to a main watchlist, then filter from there and build your focused list.
If some of the screeners don’t return any tickers, it’s because you’re checking them during the pre-market session.
!!! These screeners are meant to be checked before the market closes or immediately after closing.
Join a community of swing traders united by a single goal: Freedom! +2,918% cumulative return (Jan 2024 – Jan 2026)
The results filtered through this process are exactly the ideas I include every Saturday in High Probability Trades.
You can access this week’s edition below:
Trade Setups of The Week
High Probability Trades for 17-21 August 2026

This week’s PRO report breaks down my full momentum stock watchlist, including the setups I’m watching.
You’ll see my portfolio, my open positions, and the exact stocks I’m targeting.. all based on the same swing trading system.
If you want to trade smarter ,not longer , and get my weekly watchlist with setups, and portfolio breakdowns, this one’s for you.
If you think this newsletter could help your friends, share it with them so it can reach as many traders as possible.
And here’s the fun part: when you share it, you can unlock special rewards + you will look smart in front of your friends :)
“One trade closer to freedom.”
Vladislav
This is very generous of you, much appreciated it!
Substack should add like a donation button on free posts like this.
This is genuinely gold thank you so much. It is really helpful for people who cannot afford to pay for a subscription, which is my case, but I surely would if I had the money.