

I Made $16,521 from Trading in October
Full Risk Analysis Inside Trading Performance | Edition 37

Dear traders,
October is officially in the books, and what a month it’s been.
As a transparent trader, you know I share both my wins and my losses.
Just like it’s a learning experience for me, I believe it can help you as well. Unfortunately, there aren’t many people in this industry who are truly transparent.
I want to be different and show you that it’s possible… all of it while having a job.
I’ve worked a full-time job throughout my 20s, and I know it’s possible because I’ve done it myself. (PS: I still do)
That’s exactly why I created this system... for people like you who want to achieve freedom while working, taking care of your families, and pursuing your hobbies.
Without too much introduction, here’s a screenshot of my trading journal calendar:
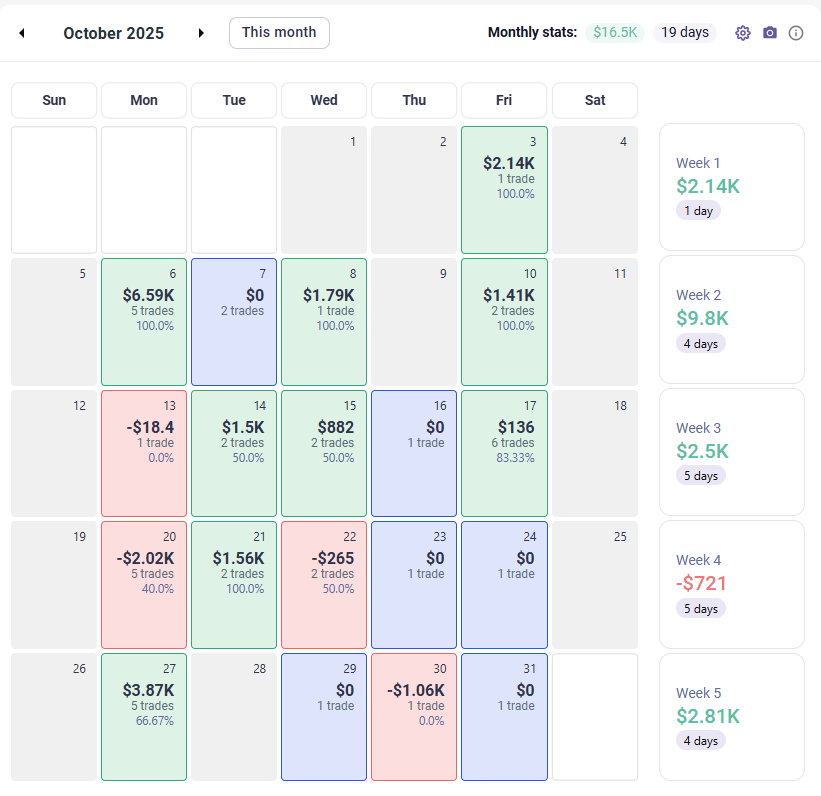
But this calendar means nothing unless we also look at how much we risked to make that money.
To evaluate performance correctly, we always need to look at it through the lens of risk measures.
Here is a screenshot of the Risk measures of my account from my broker:
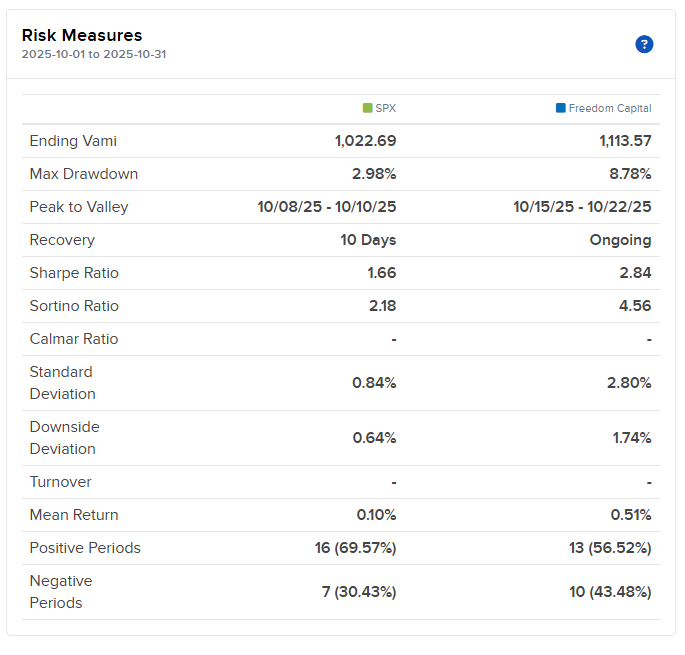
I closed October with a +11.35% gain.. The S&P 500 only managed +2.27%, so performance-wise, we crushed it. The Sharpe Ratio came in at 2.84 and the Sortino at 4.56, both signaling strong risk-adjusted returns.
Most of the profits came early in the month, Week 2 alone brought in $9.8K, almost 60% of total gains. The back half of October was sloppy: smaller edges, and a few unnecessary red days that chipped away at consistency.
The most important risk indicators for me are: Max Drawdown, Sharpe Ratio, Sortino Ratio, and Mean Return.
Once again, here’s a screenshot from my trading journal:
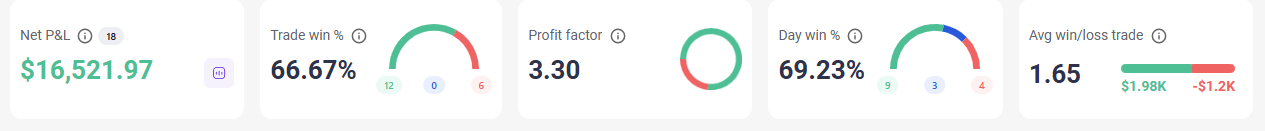
Net P&L: $16,521
Win Rate: 66.67%
Profit Factor: 3.30
Avg Win/Loss: 1.65
Day Win %: 69.23%
System held up beautifully in the first 3 weeks. Risk/reward remains solid. A 3.30 profit factor means losses were well-contained overall.
Where I think I can improve, and what I need to pay more attention to going forward, is the max drawdown of 8.78%. I need to do a better job protecting my capital.
The number of trades increased to 24 compared to 19 last month, while the profit factor dropped significantly to 3.30, down from 8.67 the previous month.
Heading into November, the focus is:
better position size during drawdown recovery.
Make my stop loss tighter than 10% for new positions when the market is not aligned.
To do a better job tagging my trades and spend more time analyzing them.
Of course, I keep an eye on many more metrics, but this is just some of the main metrics that I care about. Don’t forget there’s also the psychological side!!!
If you feel like now is the time to take your trading seriously, join the Freedom Trades community today.
Trade Setups of The Week
High Probability Trades for Week 44, 2025

This week’s PRO report breaks down my full momentum stock watchlist, including the setups I’m watching for potential 20–30% moves.
You’ll see my portfolio, my open positions, and the exact stocks I’m targeting.. all based on the same swing trading system.
If you want to trade smarter ,not longer , and get my weekly watchlist with setups, and portfolio breakdowns, this one’s for you.
Copy My Watchlist for next week
Here are the stocks, sectors, or trends I’m watching closely.
Access my entire watchlist for free here:
My watchlist
Want more than just a watchlist?
Get an understanding of the screener, so you know exactly what to watch.
Gain access to my trading strategy!
Join a community of like-minded individuals who are committed to achieving financial freedom and taking control of their future.
Upgrade now to get the full experience!
Economic events to watch next week
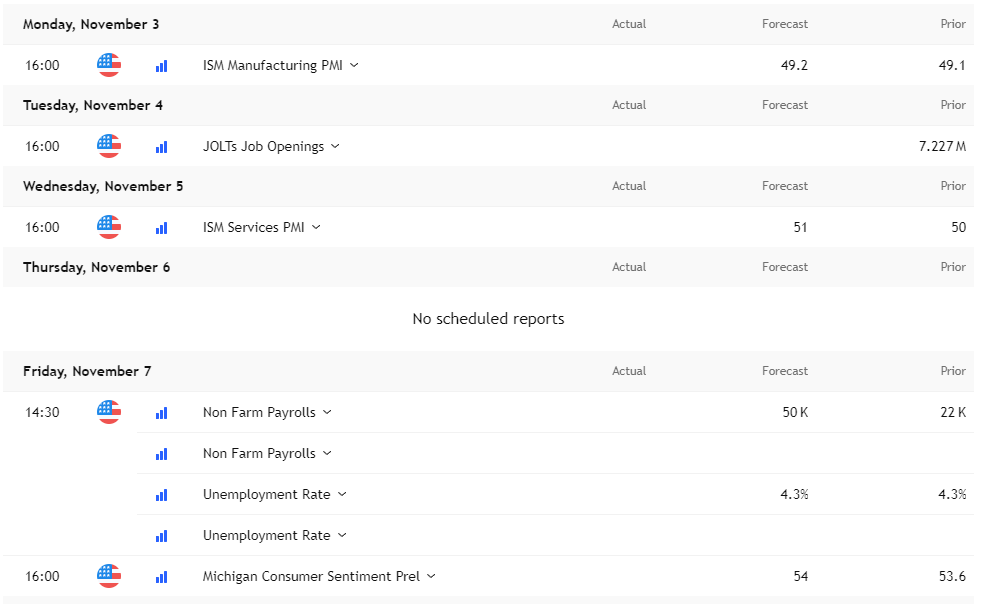
ISM PMI and Michigan data will be released, as they aren’t affected by the government shutdown… but for the others, we have no idea.
The parties have already failed to reach an agreement for over 32 days.
Earnings to Watch Next Week
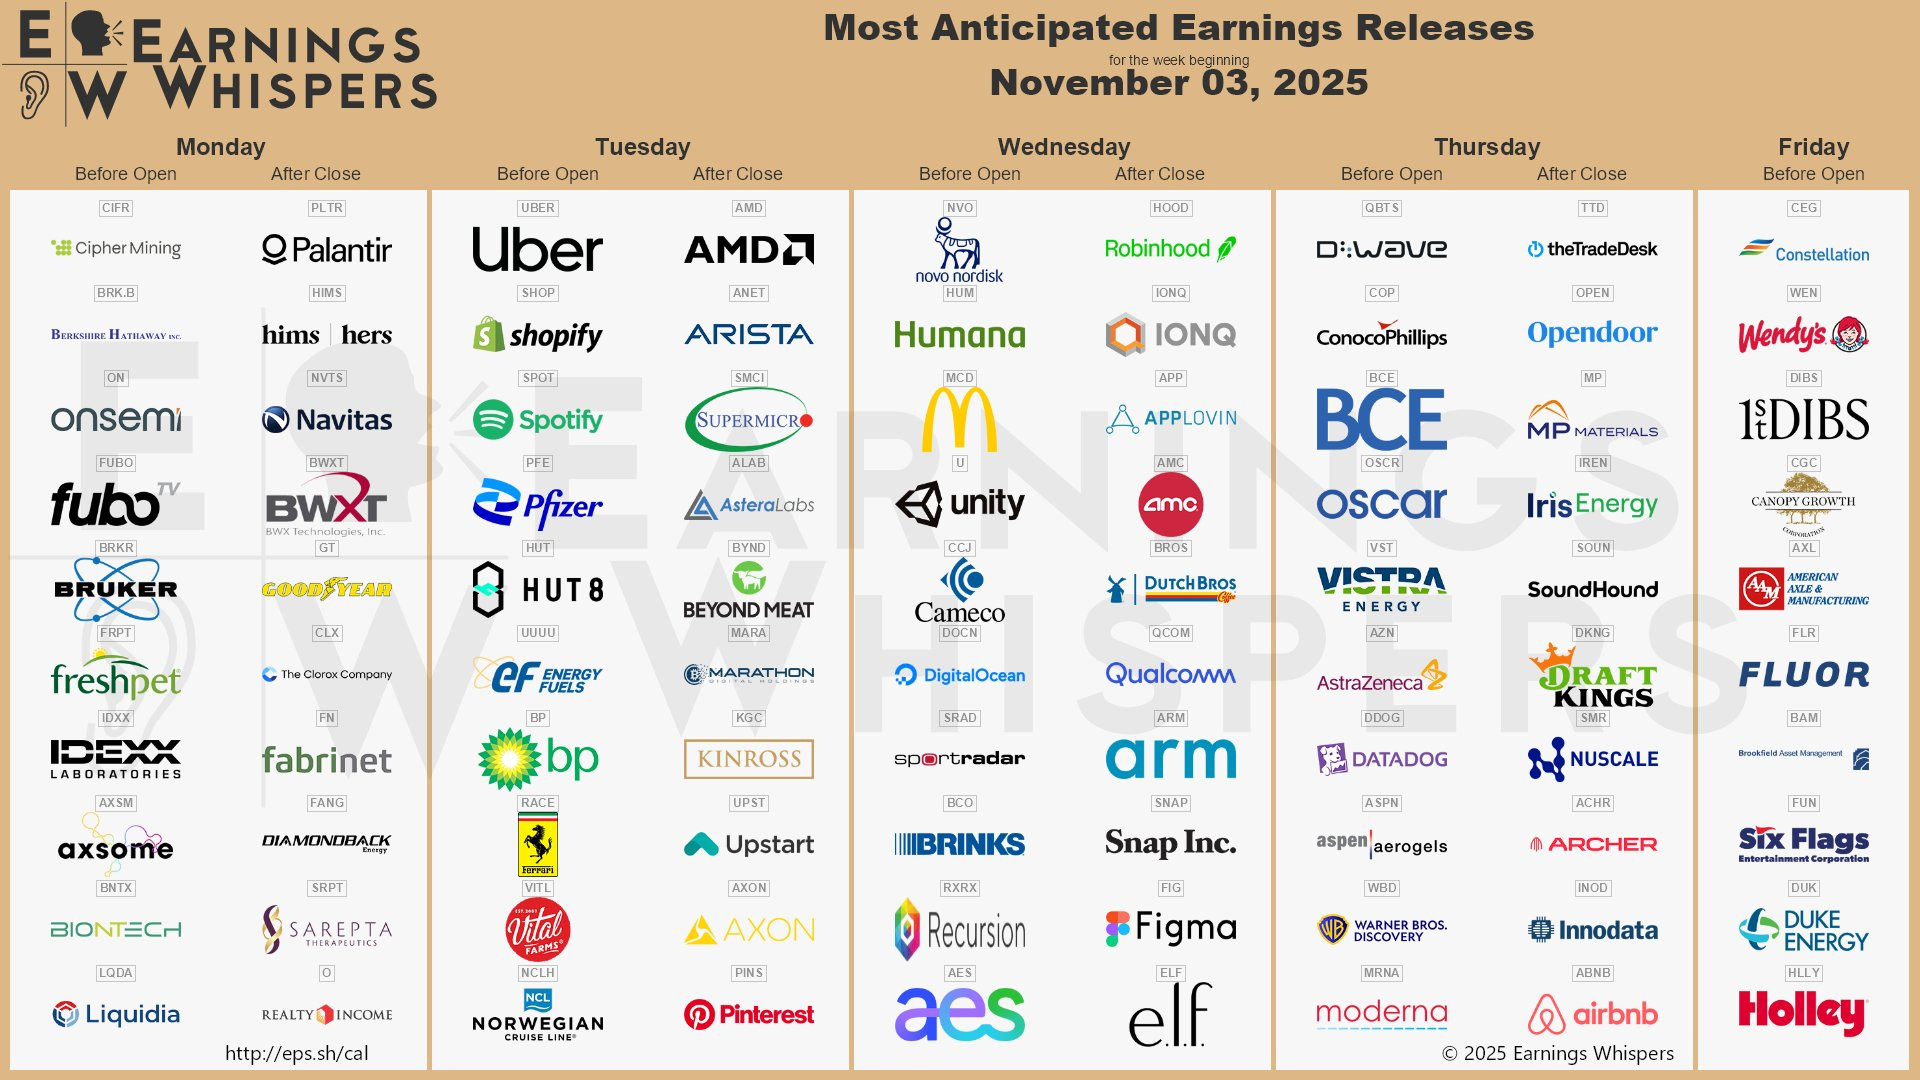
A third of the Russell 2000 reports earnings this week!
Fear & Greed Index of the week
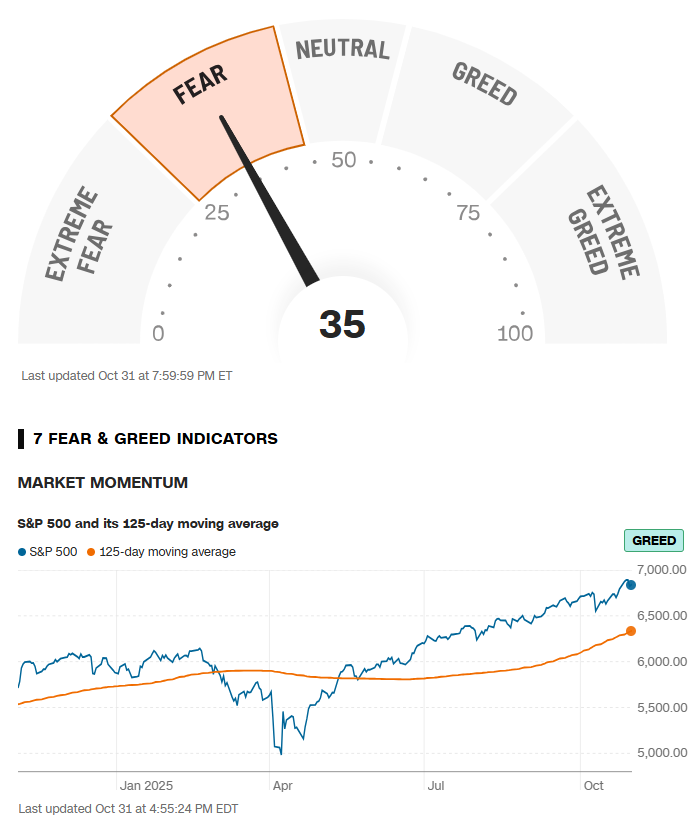
Market momentum is on the greed side, while the indicator is showing fear. This is happening because a few big stocks can skew overall market returns. It’s important to also see how many stocks are performing well versus how many are struggling.
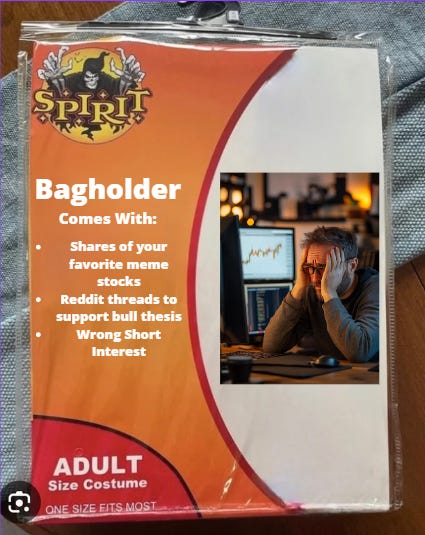
Financial Meme of the week
If you think this newsletter could help your friends, share it with them so it can reach as many traders as possible.
And here’s the fun part: when you share it, you can unlock special rewards + you will look smart in front of your friends :)
“One trade closer to freedom.”
Vladislav
Very impressive! Great job!
Awesome! What does that equate in percentage for the month?