

Use This To Fix Your Risk Management
Position Size Calculator for TradingView | Edition 49

Dear Traders,
Last week, we discussed risk management and how to avoid blowing up your trading account.

Today I’m giving you the piece that makes risk management easy: position sizing.
I've created a TradingView tool that, if you use it, will significantly improve your profitability, and I’m giving it to you for free at the end of this post.
Please keep reading so you understand how to use it to your advantage and why you should use it.
Why Most Traders Blow Up (And It’s Not Their Strategy)
Most accounts don’t die from a bad setup.
They die from one oversized trade that looked normal.
You feel confident.
You size up.
Your stop hits.
What should’ve been a small loss becomes a real problem.
That’s why I built this.
What This Tool Does: A “No Excuses” Position Size Calculator
Position Size FT is a free TradingView indicator that calculates your exact position size in seconds.
You enter:
your account equity
your risk per trade
your stop logic
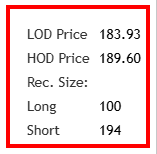
And it prints the correct recommended size for long and short, directly on the chart.
So you stop guessing.
The 4 Reasons You Should Use This on Every Chart
1) Exact position size, instantly
It saves you a lot of time by automatically calculating your position size.
2) Consistent risk, even when stops change
Wide stop or tight stop, your risk stays controlled.
A “normal” trade can’t turn into a big loss.
3) It blocks sizing mistakes
Reusing the last size. Moving the stop. Oversizing because you’re “sure.”
This tool keeps you consistent.
4) It makes drawdown control automatic
Drop risk from 1% to 0.5% or 0.25% and the tool enforces it without you negotiating with yourself.
Why I Recommend 0.25% Risk When You’re New (With Real Numbers)
If you risk 0.25% per trade, each loss leaves you with 99.75% of your account.
Capital left after n losses:
Equity × (0.9975)^n
Here’s what that looks like:
50 losses in a row: 0.9975^50 = 0.882 → 88.2% left
100 losses in a row: 0.9975^100 = 0.779 → 77.9% left
200 losses in a row: 0.9975^200 = 0.606 → 60.6% left
300 losses in a row: 0.9975^300 = 0.472 → 47.2% left
500 losses in a row: 0.9975^500 = 0.286 → 28.6% left
920 losses in a row: 0.9975^920 = 0.100 → 10.0% left
~1840 losses in a row: 0.9975^1840 ≈ 0.010 → ~1.0% left
To be blunt: you’d need hundreds of consecutive losses to practically destroy the account.
That’s basically impossible, even if your goal was to blow up your trading account.
This tool fixes the discipline problem by making sizing automatic.
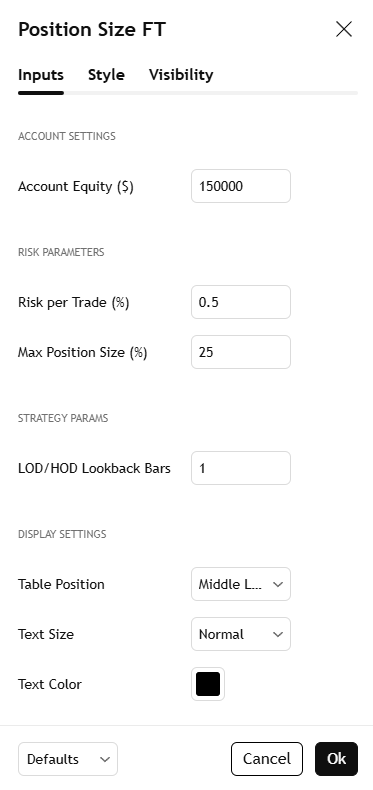
Best Settings for the Position Size Calculator
Account Equity ($)
Set this to your real account value.
Update it weekly.
If this number is wrong, every output will be wrong.
Risk per Trade (%)
This is what you lose if the stop is hit.
My system rule set:
0.25% = new, inconsistent, or rebuilding confidence
0.50% = normal size
1.00% - 2% = only at all-time high + clean market
0.25% = drawdown over 10% / 5 conssecutive losses or ugly market
Max Position Size (%)
Set this to 25% max.
This is your seatbelt.
Tight stops can make position size explode. This cap prevents loading too much into one trade.
LOD/HOD Lookback Bars
This chooses which low or high the tool uses for the stop reference.
Set to 1 = current day Low of Day / High of Day
Set to 2 = previous day Low of Day / High of Day
If you change which level you use, change this too.
Display Settings
Put the table anywhere that doesn’t block price.
Text size normal.
Black text on light charts, white text on dark charts.
On your chart, it should look something like this:
Download: Free Position Size Calculator for TradingView
Put this Position Size Calculator for TradingView on every chart you trade.
Let the tool be strict so you don’t have to be.
Add the indicator here:
https://www.tradingview.com/script/NbqQxXEL-Position-Size-FT/
This tool solves one problem: sizing.
But sizing is only powerful when you know exactly what you’re sizing into.
Inside Freedom Trades Pro I break down the full strategy, the entries I take, when I skip trades, how I set stops, and how I adjust risk based on performance.
If you join now on the yearly plan, you get 2 months free.
Trade Setups of The Week
How to Find 10x Stocks Before They Move

This week’s PRO report breaks down my full momentum stock watchlist, including the setups I’m watching.
You’ll see my portfolio, my open positions, and the exact stocks I’m targeting.. all based on the same swing trading system.
If you want to trade smarter ,not longer , and get my weekly watchlist with setups, and portfolio breakdowns, this one’s for you.
Copy My Watchlist for next week
Here are the stocks, sectors, or trends I’m watching closely.
Access my entire watchlist for free here:
My watchlist
Want more than just a watchlist?
Get an understanding of the screener, so you know exactly what to watch.
Gain access to my trading strategy!
Join a community of like-minded individuals who are committed to achieving financial freedom and taking control of their future.
Upgrade now to get the full experience!
Economic events to watch next week
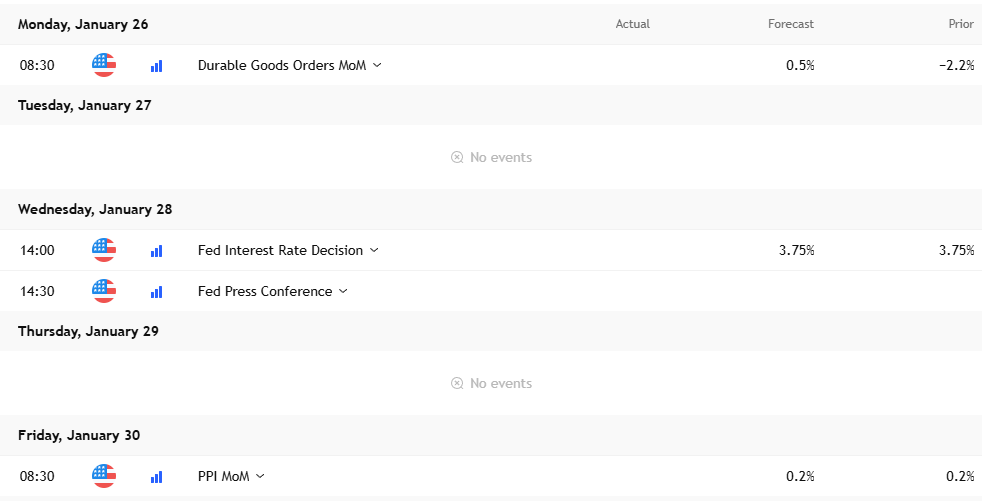
Quiet week until Wednesday, then the Fed rate decision + press conference will be the volatility event. Friday PPI can spark a second move, so treat Wed and Fri as “trade smaller, trade cleaner” days.
Earnings to Watch Next Week
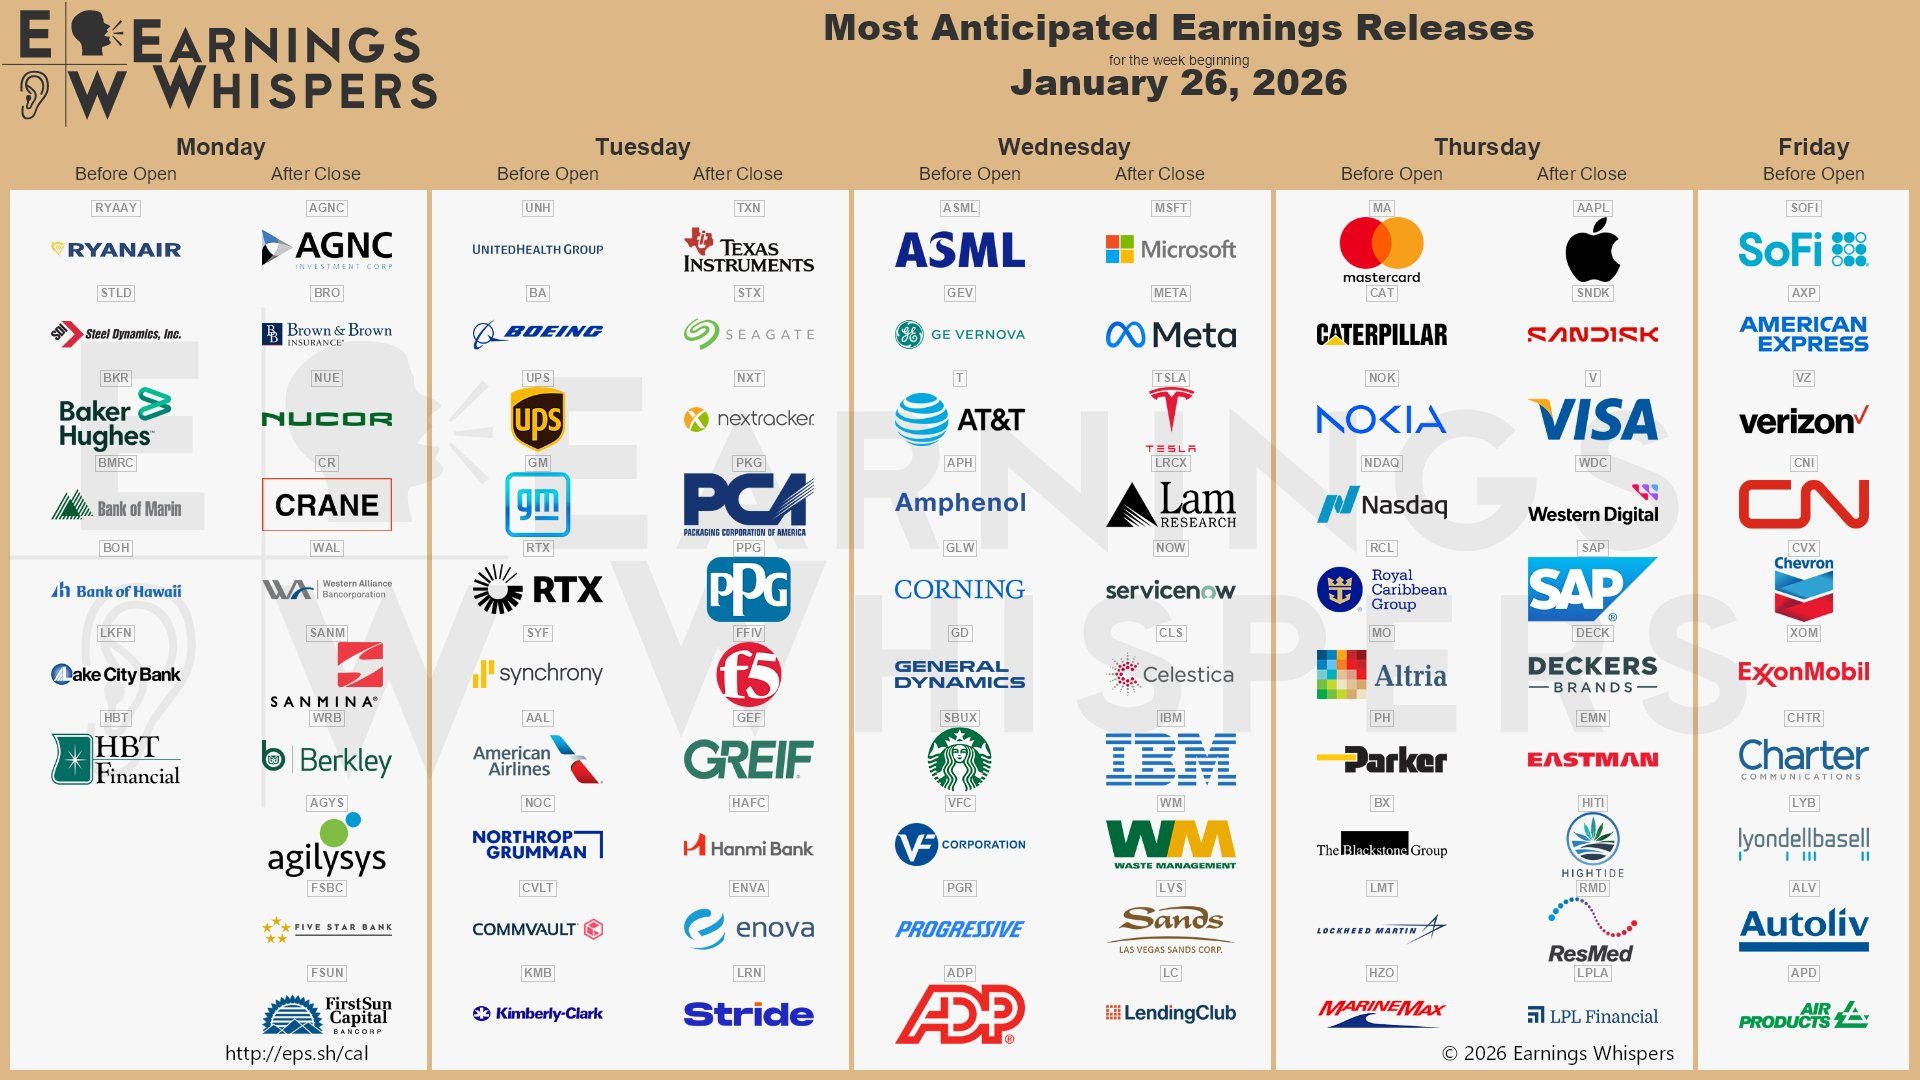
There are 103 S&P 500 companies reporting this week, and a quarter of them will be Industrials.
Over the next five weeks, we’ll get 83% of the S&P 500 reporting.
Earnings season for the large caps peaks during the first week of February.
$NVDA will report during the last week of February.
Fear & Greed Index of the week
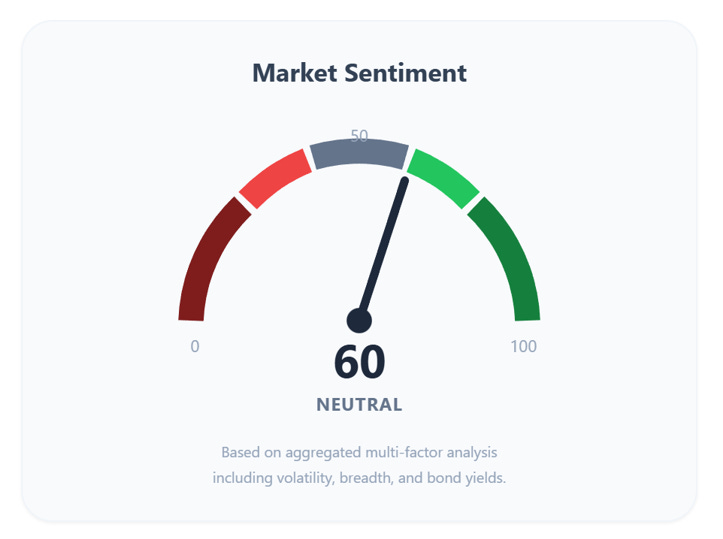
If you want the full picture with all the signals and context that sits behind this number, consider upgrading so you can see the complete breakdown.
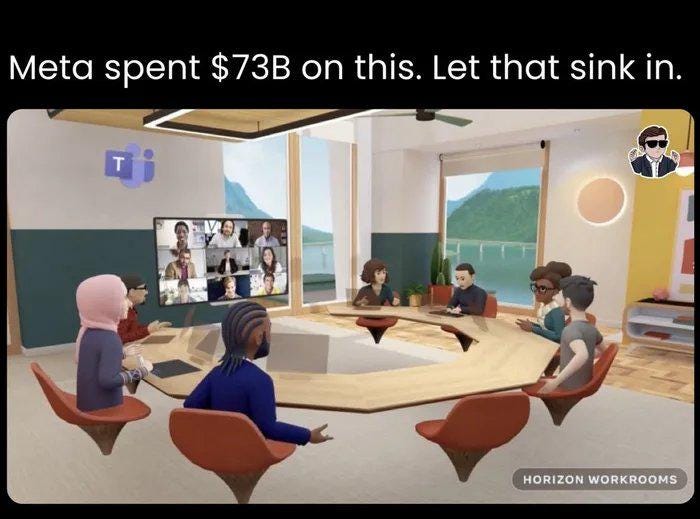
Financial Meme of the week
If you think this newsletter could help your friends, share it with them so it can reach as many traders as possible.
And here’s the fun part: when you share it, you can unlock special rewards + you will look smart in front of your friends :)
“One trade closer to freedom.”
Vladislav
Ty. I enjoy reading your posts one of these days I might even pay for a subscription to your content. I've invested alot in my education this year and am going to run it for the next ten months so it is what it is. But appreciate what you are making available for sure.
Sorry, newbie question - what do long vs. short mean on the table?